Rate Hopes and Bubble Fears

Compound is a digital family office for entrepreneurs, professionals, and retirees who want the personal touch of a dedicated advisor accompanied by a beautiful digital experience.
November brought a mix of volatility and resilience as investors navigated the fallout from the prolonged government shutdown and the long-awaited release of key economic data.
A sharp mid-month pullback underscored concerns about weakening consumer confidence, rising unemployment, and ambiguity around the true underlying strength of the economy.
Questions also arose around whether the extraordinary pace of AI-related capital spending signals a healthy expansion of a transformative technology or echoes of past investment manias.
But the tone shifted into Thanksgiving week as dovish Federal Reserve remarks reignited hopes for a December rate cut and helped markets recover lost ground.
While economic signals grew murkier, particularly around employment and inflation, easing policy expectations and ongoing strength from the biggest AI leaders supported a modestly positive finish to the month.
Last month at a glance
- Market Performance: A Thanksgiving week rally fueled by increased hopes for a December rate cut helped most equity indices end the month in positive territory.1 Technology and AI-related stocks saw heightened volatility and falling prices over the month. Treasuries also rallied to end the month with the 10-year rate falling to 4.02%.2
- Private Markets: US IPO activity has slowed in Q4 but is still up 43% so far in 2025 compared with last year. The Renaissance IPO index rallied at the end of November, but weakness earlier in the quarter has left it up just 5.8% this year.3
- Trade Policy Developments: The Supreme Court appeared skeptical of the administration's use of the Emergency Economic Powers Act to justify tariff imposition and investors are increasingly anticipating some invalidation of current tariffs. Court challenges and tariff imposition via other means would likely follow any ruling against current tariffs, but the looming decision means investors and corporations continue to deal with trade-related uncertainty.4
- Federal Reserve: Expectations for a December rate cut swung dramatically during the month. Hawkish comments after the Fed’s October meeting and delayed economic reports dropped the probability for a December cut to 30% by mid November. More dovish comments from several Fed board members to end the month and some weakening in employment growth pushed December cut odds up to 90%.5
- Government Shutdown: The record 43-day shutdown ended on November 13th. The resulting delayed release of economic data complicated assessment of the economy for investors and the Fed.
- Economic Data:
- The delayed September employment report showed stronger-than-expected job gains of 119,000 but an increase in the unemployment rate to 4.4%.6 The next employment release will not occur until December 16th, after the Fed’s final meeting of the year on December 9th. That release will contain jobs numbers for both October and November but unemployment rate for only November.
- Inflation data for the Fed’s preferred PCE index for September will finally be released on December 5th. There will be no October PCE data, but November data will be released later in December. The Cleveland Fed’s inflation Nowcasting data shows November PCE inflation running at 2.91% from a year earlier, up slightly from their September and October estimates.7
- Consumer sentiment fell in November on lingering concerns from the government shutdown and persistent inflation and slowing labor markets. The University of Michigan consumer sentiment index fell to 50.3, a three-year low.8 The Conference Board’s consumer confidence index fell sharply in November from October hitting the second-lowest level in five years.9
- Earnings: Q3 earnings growth for the S&P 500 was 16.9% vs. 8.8% expected with all sectors beating earnings expectations. Revenue growth was also strong at 8.4%, the highest since Q3 2022. Despite investors' concerns about the sustainability of the AI investment boom, the Magnificent 7, and AI-related companies more generally, continued to deliver exceptional earnings growth.10
Stocks rally as Fed expectations shift
Equities ended November modestly higher after a volatile month in which shifting expectations for Federal Reserve policy and delayed economic data created several bouts of uncertainty. Markets sold off sharply in the middle of the month as concerns grew over weakening consumer sentiment, rising labor-market slack, and the lack of key economic releases due to the government shutdown. However, a late-month rally driven by increasingly dovish commentary from multiple Fed officials and a sharp rise in the probability of a December rate cut helped stocks claw back losses and finish the month in positive territory.11
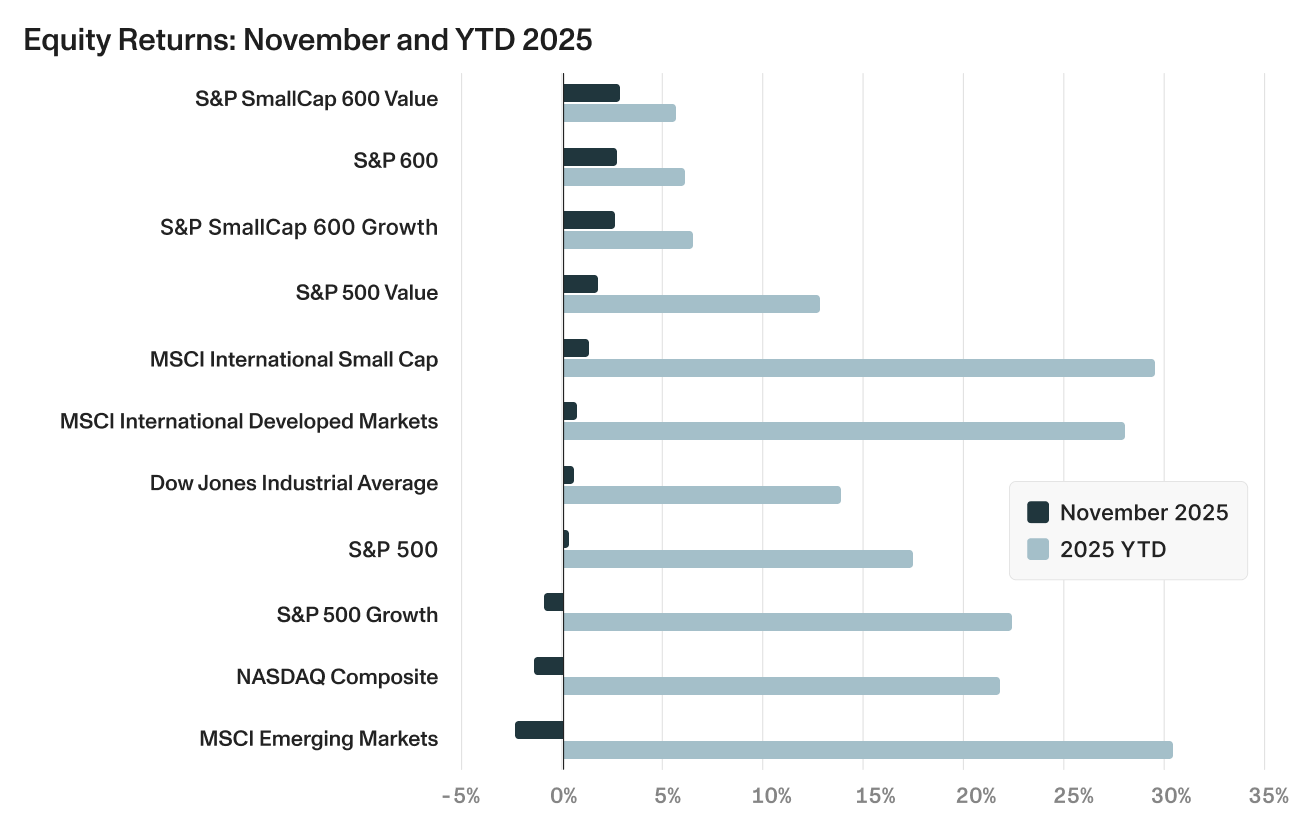
- The S&P 500 rose 0.25% in November and is now up 17.81% year-to-date, recovering from a –3.5% drawdown just a week before month-end.
- Growth and tech stocks lagged, with the S&P 500 Growth index down –0.93% and the NASDAQ off –1.45% in November amid renewed volatility in AI-linked names, though the category remains up 22.39% year-to-date.
- U.S. small-cap stocks outperformed large caps in November, with the S&P SmallCap 600 up 2.65% and both value and growth segments gaining more than 2.5%. Still, small caps remain negative over the past year and continue to be more sensitive to economic soft patches, financing conditions, and shifting expectations for monetary easing.
- International equities were mixed. Emerging Markets declined –2.38% for the month as tariff uncertainty and weaker Chinese data weighed on returns. Developed international equities fared better, with the MSCI EAFE index up 0.64% and international small caps rising 1.23% in November.
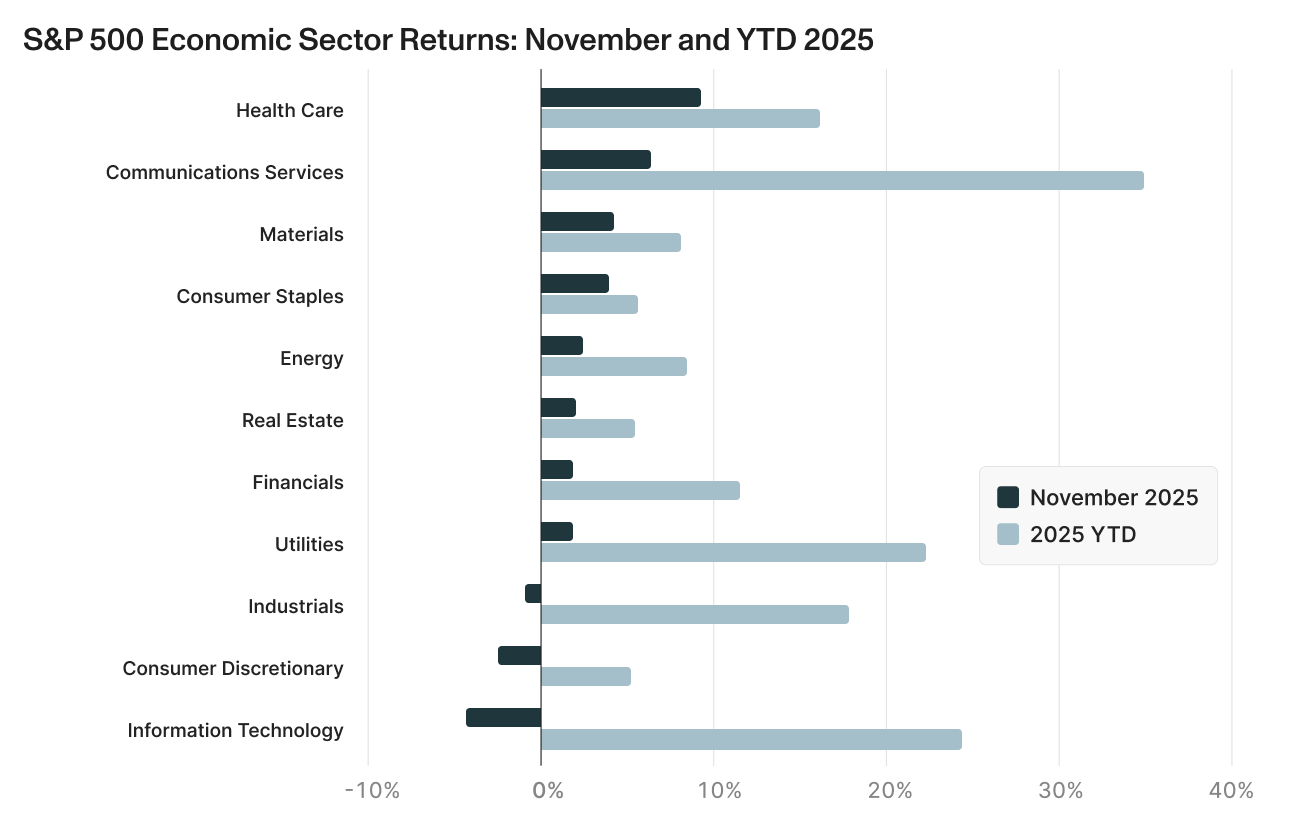
- November sector performance was broadly positive, with all 11 S&P 500 sectors rising in the final week of the month and several reversing earlier declines.12
- Health Care led all sectors in November, rising 9.31%, supported by strong earnings from major pharmaceutical names and a rotation into more defensive, cash-flow-stable industries.
- Communication Services gained 6.35%, driven by strong performance from Alphabet and Meta
- Consumer Discretionary fell –2.39%, pressured by weakening consumer sentiment and mixed earnings trends across retail, autos, and travel.
- Information Technology posted the weakest sector return at –4.29%, as mid-month AI volatility, competitive pressures, and concerns about large-scale data-center funding weighed on mega-cap tech.
Bonds advance on changing rate cut outlook
Fixed income markets delivered modest but broadly positive returns in November, supported by a late-month rally in U.S. Treasuries as expectations for a Federal Reserve rate cut in December increased sharply. After several weeks of hawkish commentary and uncertainty caused by the government data blackout, dovish remarks from key Fed officials, New York Fed President Williams in particular, helped reverse the earlier rise in yields. As rate-cut odds surged from below 35% to 90% by month-end, longer-dated Treasuries strengthened and credit markets stabilized.17
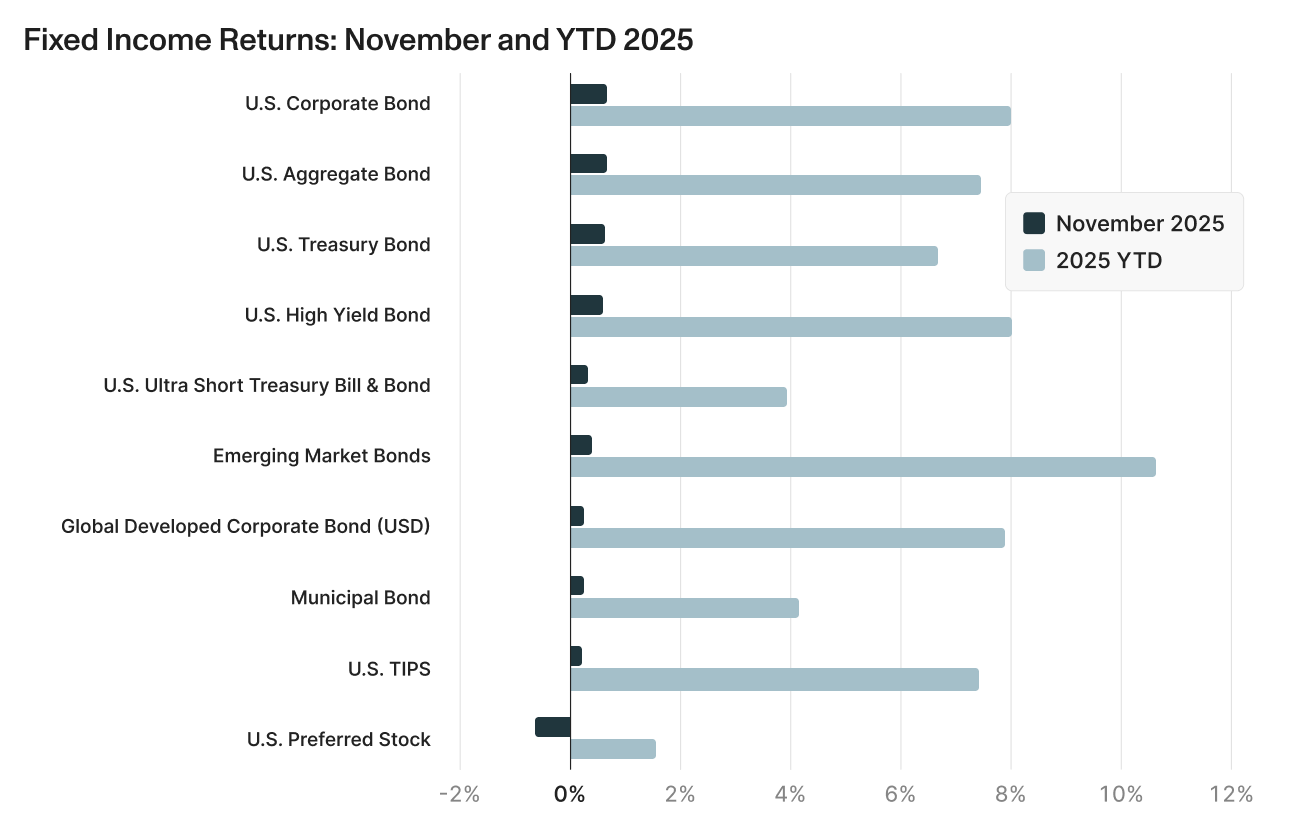
- Investment-grade corporate bonds returned 0.65% in November, despite modest spread widening due to heavy supply and cautious risk sentiment.
- U.S. Treasuries rose 0.62% for the month, with yields falling across the curve as dovish Fed repricing drove a bond-market rally. Treasuries are now up +6.67% year-to-date.
- Emerging market bonds, the leading sector for the year, returned 0.24%, underperforming U.S. credit as EM spreads widened slightly amid volatile risk sentiment and ongoing tariff-related uncertainty.
- Municipal bonds rose 0.23%, supported by strong demand, light issuance heading into the holidays, and nearly $42 billion of reinvestment flows arriving in early December.
- Preferred securities declined –0.62%, extending their weak Q4 performance on both duration sensitivity and credit concerns.
Looking forward: Key areas to watch
A Slowing and Murky Job Market
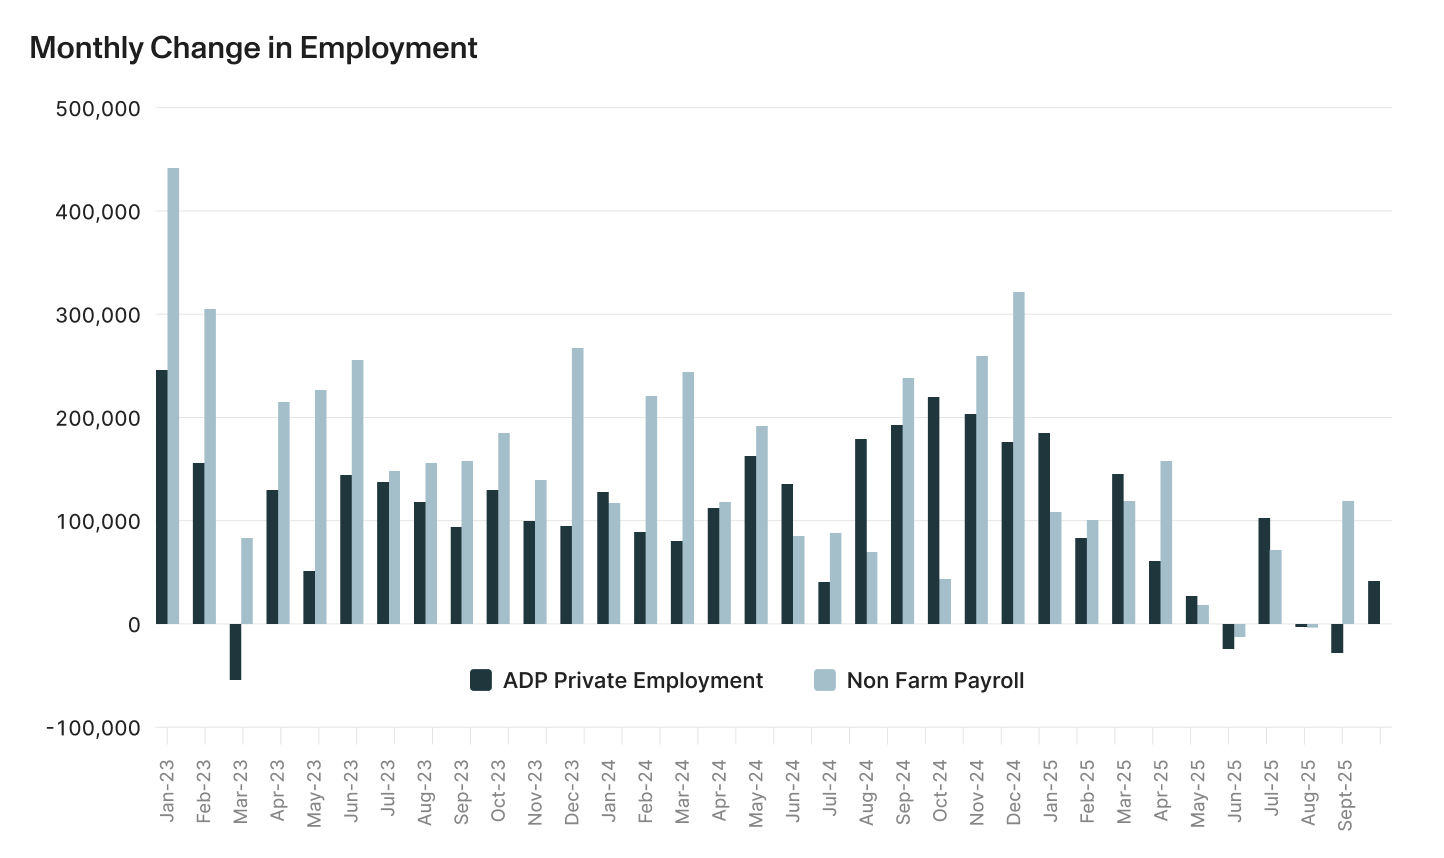
The November employment landscape reflected a labor market that is showing signs of losing momentum, but still far from collapsing. The delayed September nonfarm payrolls report showed headline job gains coming in stronger than expected at 119,000, more than double the prior three-month trend.18 Beneath the surface the picture was more fragile as downward revisions erased earlier gains, and hiring strength remained narrowly concentrated in a handful of sectors. The ADP private payrolls report for October told a similar story with a rebound of 42,000 jobs added in the month after two months of weak hiring.19 Still, the gains were much lower than the government figures and the rate posted earlier this year. In addition, the gains in October were not broad-based and for the third straight month, employers shed jobs in professional business services, information, and leisure and hospitality. Taken together, the two job measures point to an economy where hiring is decelerating and where employers are increasingly cautious, particularly in interest-rate-sensitive and service-oriented industries.
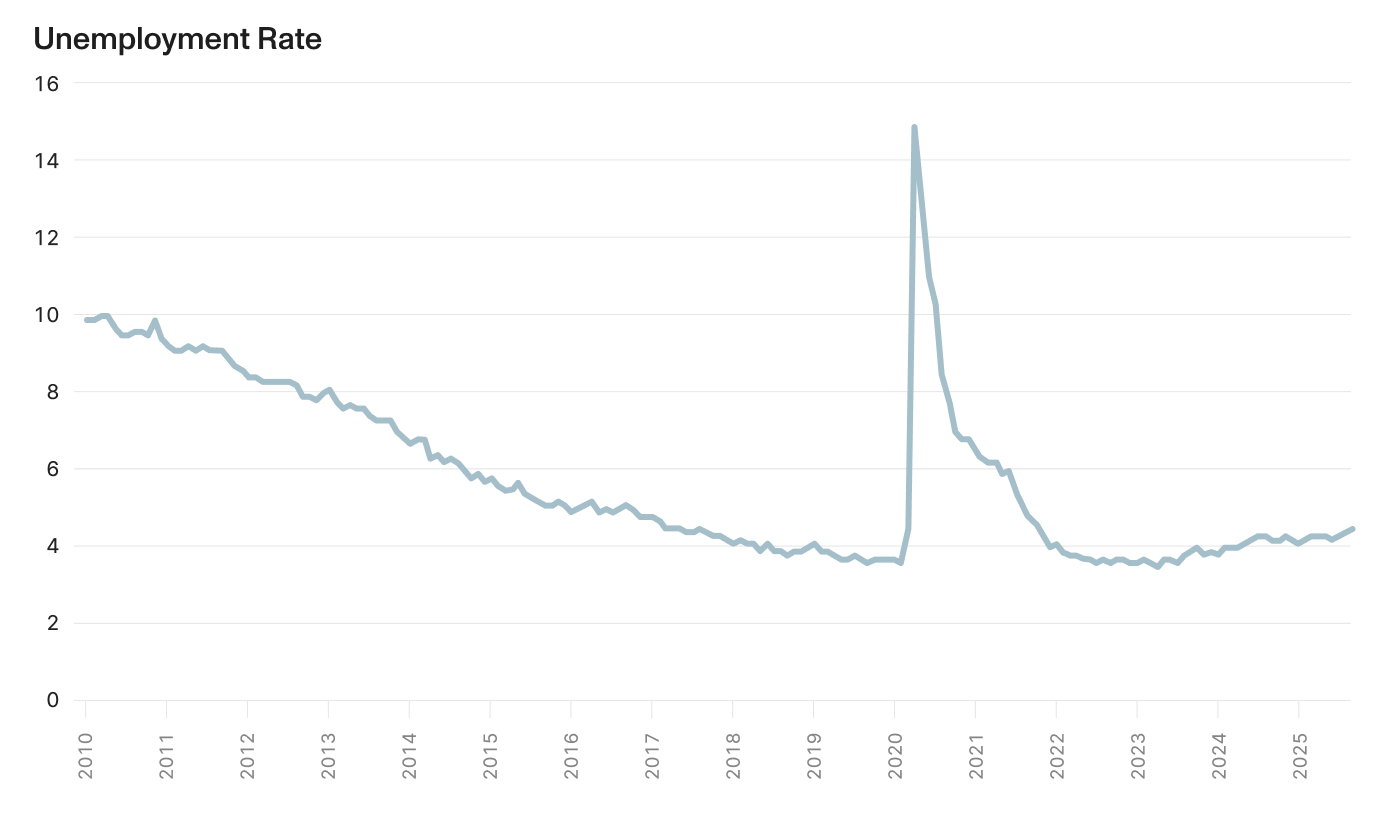
The trends in the unemployment rate further underscores this loss of labor-market momentum. September’s reading rose to 4.4%, the highest level in four years and slightly above expectations for a steady 4.3% rate.22 This rise was not merely the result of expanding labor supply, but reflected genuine softening in labor demand. Survey data from the Conference Board also showed increasing concerns about the state of the labor market, with the gap between Americans saying jobs are “plentiful” versus “hard to get” narrowing to its second-smallest level since early 2021.23 The decline in perceived job availability aligns with businesses reporting weaker demand, slowing revenue growth in several industries, and the rising influence of productivity-enhancing technology — particularly AI — on staffing decisions. While the unemployment rate remains historically low, its recent trend is unambiguously upward and suggests the labor market may already be shifting from late-cycle firmness to early-cycle contraction.
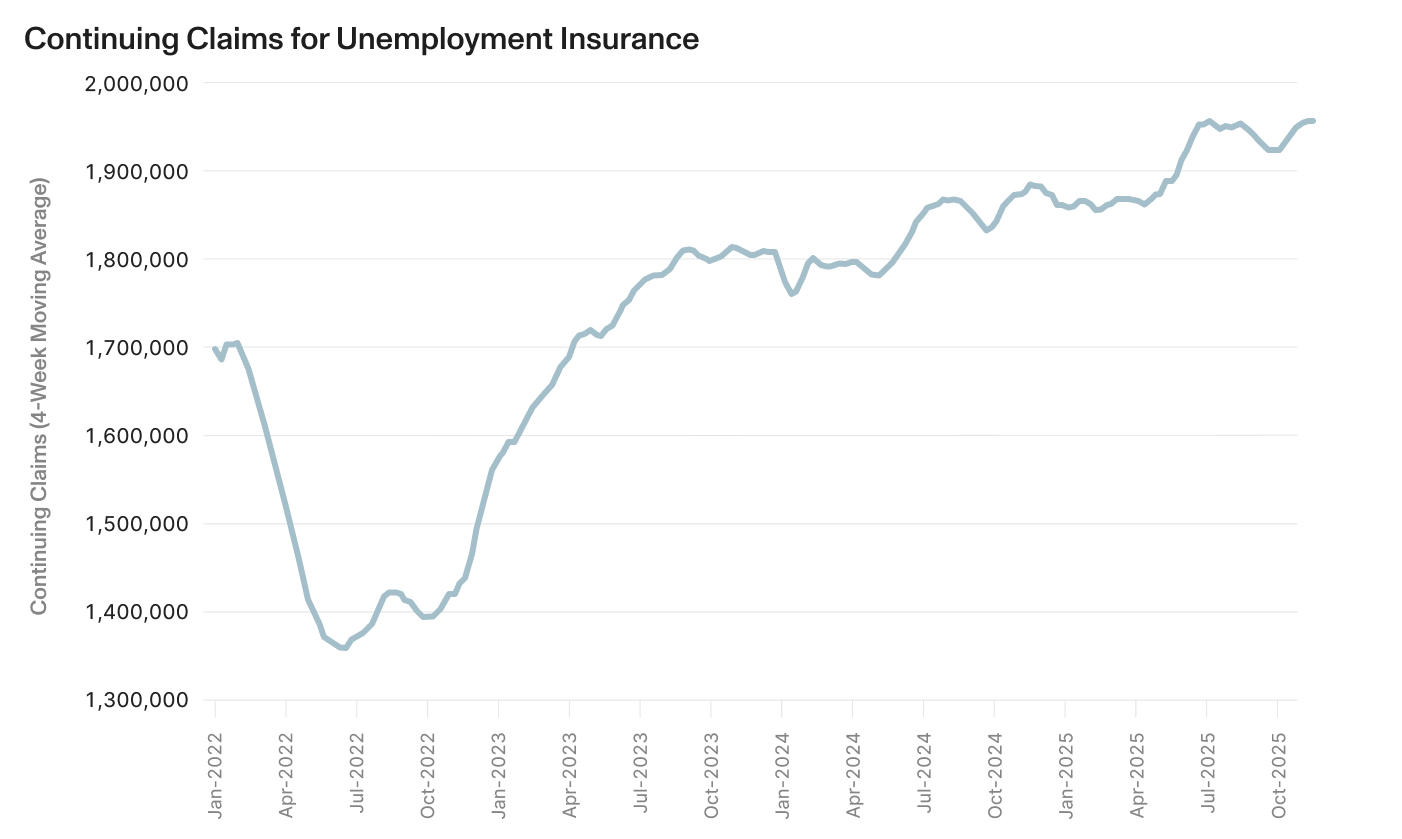
Meanwhile, continuing claims for unemployment insurance rose to 1.97 million, marking a new cycle high and the highest level since 2021.24 Unlike initial claims, which can be volatile week to week, continuing claims capture the number of people who remain on benefits and therefore reflect the pace at which unemployed workers are finding new jobs. The steady climb in continuing claims throughout the fall signals that re-employment is becoming more difficult and that job openings, while still above pre-pandemic levels, are no longer absorbing displaced workers as readily as they did earlier in the expansion. This trend is consistent with easing wage pressures, a slowdown in service-sector activity, and tighter corporate budgets as profit margins come under pressure.
Together, the government payrolls data, the ADP report, the rising unemployment rate, and the increase in continuing claims all point to a labor market that is cooling in a measured but persistent way. For the Federal Reserve, this softening has become a central factor in the debate over further rate cuts. While policymakers remain divided, the recent data provide growing evidence that the labor market may no longer be a source of inflationary pressure and may in fact be approaching the point where slower hiring and rising joblessness begin weighing on broader economic growth. In that context, the employment backdrop is likely to remain a focal point for markets and policymakers heading into the final months of the year.
Employment — What to look out for:
- ADP and weekly claims data before the Fed’s December 9th meeting.
- Increased layoff announcements
- Delayed government employment reports
The AI Boom: Bubble or Reality?
The Case for Caution
The current AI investment boom displays some similarities to past speculative bubbles. In a recent research report, Alpine Macro noted that all four conditions economic historian Charles Kindleberger identified for financial manias are currently present: a major technological displacement, hard-to-value financial assets, retail speculation, and ample liquidity.26 In addition, the concentration in equity markets has reached record levels, with the top 10 S&P 500 holdings now representing roughly 39% of the entire index.27 Capital expenditure in information technology has surged to levels exceeding even the 1990s tech boom peak, with consensus 2026 capex estimates for AI hyperscalers jumping from $467 billion to $533 billion during Q3 earnings season alone — representing 34% year-over-year growth.28
History provides a sobering roadmap. Past asset bubbles in 1990s technology, 2000s housing, and 2010s shale energy all followed similar patterns: financial asset booms drove capital spending overshoots, which then crashed spectacularly when sentiment reversed. In each case, rising collateral values and falling costs of capital made massive outlays appear attractive, only for the cycle to reverse sharply once asset prices peaked.29
Market behavior is showing early signs of strain. Some notable semiconductor stocks experienced sharp selloffs even while delivering strong earnings, including Nvidia which shed 5.9% of market value despite beating estimates.30 Markets are assessing the impact of the flood of AI debt issuance and with investors increasingly skeptical about AI monetization timelines, suggesting the easy gains may be behind us.
The Case for Optimism
On the other hand, today's AI leaders bear little resemblance to the unprofitable dot-com companies that collapsed in 2000-2001. Many of those companies burned through capital with no viable business models. In contrast, today's hyperscalers are the most profitable companies in history. The Nasdaq climbed 230% in the 17 months leading to March 2000 while earnings and cash flow barely moved.31 Current AI leaders are deploying record levels of revenue and free cash flow into infrastructure investments while maintaining strong profitability.
The balance sheet capacity of AI leaders provides a crucial cushion against potential downturns. Since 2021, the hyperscalers have collectively increased net debt by only $295 billion, maintaining a collective net debt-to-EBITDA leverage of just 0.2x.32 These companies could theoretically add $700 billion in net debt without lifting leverage above 1x. Four of the Magnificent 7 companies maintain positive net cash per share, with unencumbered balance sheets capable of weathering increased debt loads. This financial flexibility means that cash flows and balance sheet constraints are unlikely to limit AI capex spending in 2026.
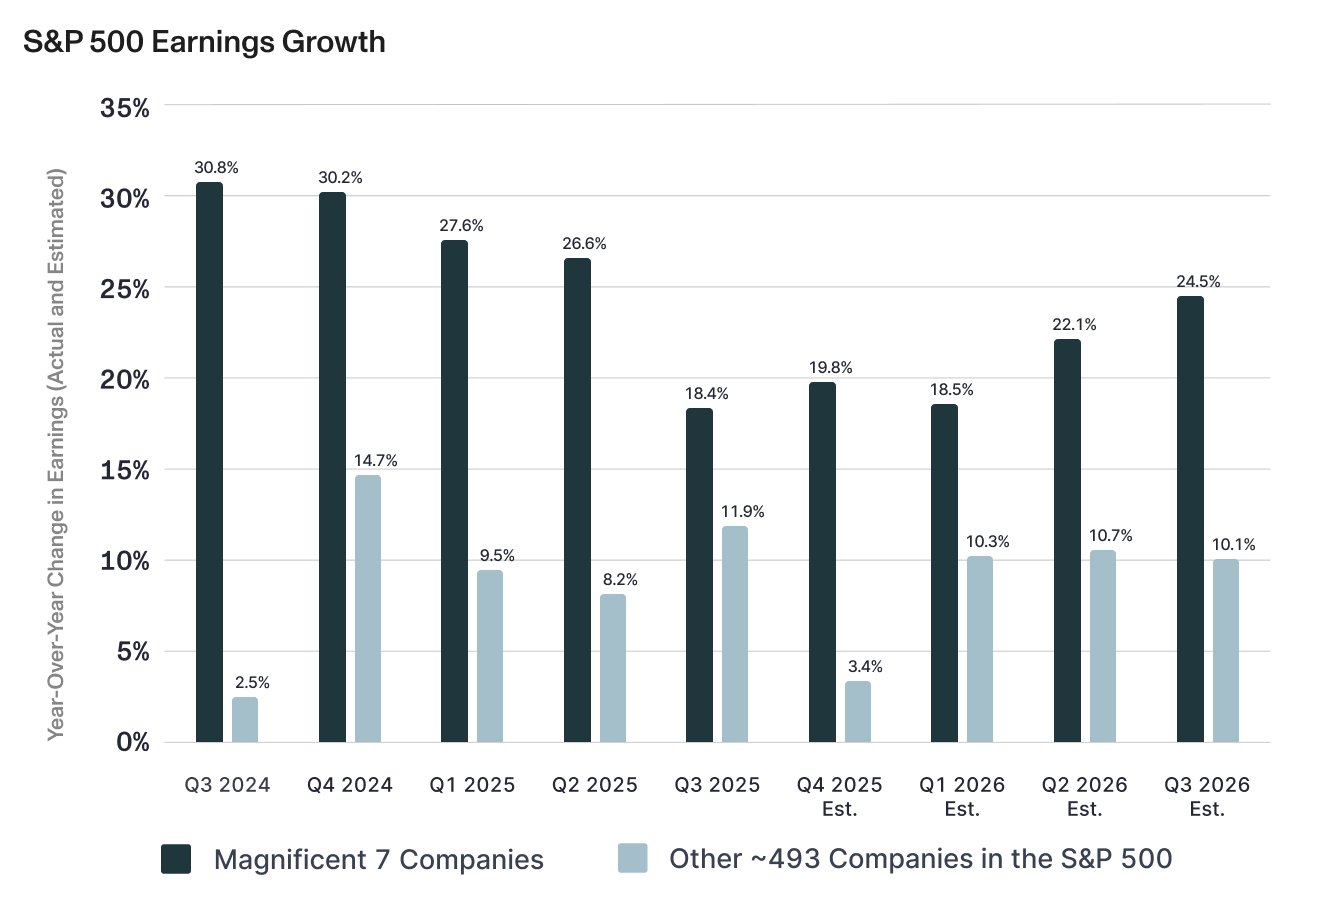
Looking at the trajectory of Magnificent 7 earnings growth from a year ago through projected Q3 2026 reveals a story of normalization rather than showing signs of weakness.33 The 18.4% earnings growth reported in Q3 2025 represents a deceleration from the 28.8% average over the prior four-quarters, but was largely due to Meta's one-time $15.93 billion non-cash tax charge. Excluding Meta, the other six companies would have reported 30.4% earnings growth. More importantly, analysts expect the growth rate to reaccelerate over the next four quarters. This forward trajectory suggests that the Magnificent 7 are navigating toward sustained high-teens to mid-twenties growth rates, consistent with a maturing but still vibrant technology cycle rather than a bubble on the verge of bursting.
On balance, the evidence suggests we are still at the early rather than late stage of the investment case for AI. Concerns are present — rising capex-to-revenue ratios, increasing leverage, market concentration — but there are few signs of imminent bursting of a bubble.35 The fundamental displacement appears to still be gathering momentum as AI capabilities spread across the economy. While historical patterns warn of eventual reversal, the combination of real profitability, strong balance sheets, and broadening earnings strength distinguishes this cycle from pure speculation. Investors should remain vigilant for signs of genuine excess while recognizing that today's AI investment boom rests on far firmer fundamental ground than the dot-com bubble that preceded it.
AI Investment Concerns — What to look out for:
- Increases in leverage ratios for AI leaders
- Comments on lower-than-expected profitability from AI investments
- Earnings misses from bellwether companies
Navigating the Path Forward
As we end the year, markets will be focused on slowing labor markets, easing inflation, and the Fed’s rate decision at its December 9-10th meeting. At the same time, investors will continue to grapple with the powerful but uneven influence of the AI investment cycle. While the sector’s profitability and balance sheet strength differentiate it from past bubbles, rising capex intensity and market concentration suggest that the line between healthy expansion and speculative excess bears close monitoring. November’s rebound showed how quickly sentiment can shift when expectations change, but the broader backdrop is increasingly complex. As the expansion matures, balancing optimism about technological transformation with recognition of late-cycle risks will be essential for navigating the months ahead.
Compound provides everything you need to manage your finances (liquidity planning, concentrated position management, stock option optimization, and more).
[1] https://www.spglobal.com/spdji/en/index-family/equity/
[2] https://www.federalreserve.gov/releases/h15/
[3] https://www.renaissancecapital.com/ipo-center?utm_source=ipo-center-nav&utm_medium=email&utm_campaign=us-calendar&inf_contact_key=bcdc540900b6f7a17b091344576b5bb67e470d92b8b75168d98a0b8cac0e9c09
[4] https://aptuscapitaladvisors.com/aptus-musings-furloughing-the-tariffs/
[5] https://polymarket.com/dashboards/fed-rates
[6] https://www.bls.gov/news.release/empsit.nr0.htm
[7] https://www.clevelandfed.org/indicators-and-data/inflation-nowcasting
[8] https://www.sca.isr.umich.edu/
[9] https://www.conference-board.org/topics/consumer-confidence/
[10] https://insight.factset.com/magnificent-7-companies-reported-lowest-earnings-growth-since-q1-2023
[11] https://www.spglobal.com/spdji/en/index-family/equity/
[12] https://www.spglobal.com/spdji/en/index-family/equity/us-equity/sp-sectors/#overview
[13] https://www.spglobal.com/spdji/en/index-family/equity/
[14] https://www.msci.com/end-of-day-data-search
[15] https://www.nasdaq.com/market-activity/index/comp/historical
[16] https://www.spglobal.com/spdji/en/index-family/equity/
[17] https://www.spglobal.com/spdji/en/index-family/fixed-income/
[18] https://www.bls.gov/news.release/empsit.nr0.htm
[19] https://adpemploymentreport.com/
[20] https://www.bls.gov/news.release/empsit.nr0.htm
[21] https://adpemploymentreport.com/
[22] https://www.bls.gov/news.release/empsit.nr0.htm
[23] https://www.conference-board.org/topics/consumer-confidence/
[24] https://oui.doleta.gov/unemploy/DataDashboard.asp
[25] https://oui.doleta.gov/unemploy/DataDashboard.asp
[26] Alpine Macro, “Capex and Asset Bubbles: Lessons From History”
[27] https://get.ycharts.com/resources/blog/dot-com-comparison-falls-short-2025/
[28] https://aptuscapitaladvisors.com/aptus-musings-q3-2025-earnings-review/
[29] Alpine Macro, “Capex and Asset Bubbles: Lessons From History”
[30] https://simplywall.st/stocks/us/semiconductors/nasdaq-nvda/nvidia/news/is-nvidias-valuation-justified-after-a-59-drop-and-ai-growth
[31] https://get.ycharts.com/resources/blog/dot-com-comparison-falls-short-2025/
[32] https://aptuscapitaladvisors.com/aptus-musings-q3-2025-earnings-review/
[33] https://insight.factset.com/magnificent-7-companies-reported-lowest-earnings-growth-since-q1-2023
[34] https://insight.factset.com/magnificent-7-companies-reported-lowest-earnings-growth-since-q1-2023
[35] Alpine Macro, “Capex and Asset Bubbles: Lessons From History”