Priced for Perfection

Compound is a digital family office for entrepreneurs, professionals, and retirees who want the personal touch of a dedicated advisor accompanied by a beautiful digital experience.
October proved to be another strong month for risk assets, with the S&P 500 extending its remarkable rally to nearly 40% from April lows despite a complex backdrop of policy uncertainty and elevated valuations.
The equity market looked past the ongoing government shutdown, now the longest on record, and volatile trade policy rhetoric to focus on continued robust corporate earnings growth and the Fed’s rate cut.
However, beneath the surface strength, warning signs emerged.
High-profile bankruptcies in the private credit space, while not expected to have a broad impact, raised questions about lending standards at the current late stage of the credit cycle and Fed Chair Powell's comments that threw the path of future rate cuts into question.
As we enter the final months of 2025, investors face a market that appears priced for perfection, with minimal margin for disappointment on either the earnings or credit quality fronts.
We will explore these risks to the outlook later in this month's market update, but first…
Last month at a glance
- Market Performance: Equity markets continued to push higher, with the S&P 500 now up almost 40% from April lows.1 Bond returns were also strong across most segments as rates fell across maturities until the last few days of the month after the Fed rate cut.2
- Private Markets: The collapse of car parts supplier First Brands and sub-prime auto lender Tricolor raised fears about weak lending standards in the private credit market.3 Despite JP Morgan chief executive Jamie Dimon’s comment that “when you see one cockroach, there’s probably more,” the impact appears to be relatively contained with Fed Chair Powell saying he didn’t see “a broader credit issue.”4
- Trade Policy Developments: Trade policy remained a source of market volatility. Early in October, the S&P 500 fell 2.4% after President Trump said he was considering "a massive increase" in tariffs on Chinese products and might cancel a planned meeting with President Xi Jinping.5 The following week, stocks rebounded 1.7% after Trump backed off the threat. Trump subsequently had a productive meeting with President Xi at the APEC Summit on October 30th where tariffs were lowered and an agreement was reached on rare earth minerals.6
- Federal Reserve: The Fed cut rates by 25 basis points on October 29th to a range of 3.75% to 4.00%, marking the second consecutive reduction in 2025 and 150 basis points total cuts since September 2024. Future cuts are now more uncertain as Chair Powell warned that "a further reduction in the policy rate at the December meeting is not a foregone conclusion—far from it". There were two dissents at the meeting with Governor Miran again favoring a 50bp reduction while President Schmid voted for no change, highlighting some division within the Fed. Markets now price about a 72% chance of a 25bp cut in December.7
- Government Shutdown: The U.S. government shutdown has now reached a full month and betting markets expect the shutdown to last 47 days, which would be the longest in history, surpassing the 35-day shutdown in 2018-2019. Despite the economic disruption, the S&P 500 has historically looked past shutdowns, posting positive returns on average, including during each of the last six and rising 10.3% in the 2018-2019 episode.8
- Economic Data:
- Inflation remains above the Fed’s 2% target but shows some signs of moderating. September CPI (a lone government data release in October) rose 3.0% year-over-year versus 3.1% expected, while core inflation edged down to 3.0%.9
- On employment, the other side of the Fed's dual mandate, Chair Powell noted that job gains have slowed, partly reflecting lower immigration and labor force participation, and downside risks to employment are now higher. Despite not having official government employment figures, Powell noted that state level claims for unemployment insurance data has not shown an increase in layoffs despite announcements of job cuts by several large companies.10
- Broader economic growth was slower in the first half of the 2025 (+1.6% real GDP growth) compared with 2024 (+2.8%), but the Atlanta Fed currently forecasts 3.9% real GDP growth for Q3.11
- Earnings: The S&P 500 earnings season has been strong, with the blended earnings growth rate for Q3 at 10.7%, marking the fourth consecutive quarter of double-digit year-over-year earnings growth. 83% of S&P 500 companies have reported EPS above estimates, the highest percentage since Q2 2021.12
Stocks rise despite high valuations
Stocks marched higher in October with growth and technology stocks setting the pace. The Fed’s expected rate cut on October 29th as well as continued strong earnings growth offset any concerns from shifts in trade policy and the impacts from the ongoing government shutdown. High stock valuations also did not dampen investors enthusiasm as leadership in the US continues to be concentrated in large cap growth and technology stocks. In general, the earnings delivered (and expected to be delivered) for these leading stocks have justified their dominant performance, but several measures show just how highly valued they are relative to both history and other parts of the market: The ratio of the performance of S&P 500 growth stocks to value stocks is now at a new all-time high, surpassing the dot-com bubble peak in March 2000; The index is trading at over 3.3x sales, its highest price-to-sales ratio in history; and, Nvidia now comprises over 8% of the S&P 500, the largest ever for any single name, while Nvidia, Microsoft, and Apple together make up over 21% of the index, the highest weighting for any three stocks on record.13
- The NASDAQ led major indices with a 4.72% gain for October and is now up 23.50% year-to-date.
- Growth significantly outperformed value, with the S&P 500 Growth index up 3.35% versus just 1.13% for the S&P 500 Value index.
- Emerging Markets continued their recent momentum, gaining 4.19% for the month and are now up 33.59% year-to-date.
- Small-cap stocks posted negative returns for the month both in the US and internationally, reversing their Q2 leadership.14
- October saw a clear bifurcation in sector performance, with technology and growth-oriented sectors leading while defensive and rate-sensitive sectors lagged.15
- Technology posted the strongest gain at 6.23% for the month and leads all sectors year-to-date with a 29.93% return.
- Financials and Real Estate underperformed for the month despite the Fed's 25 basis point rate cut as investors weighed the possibility of no further cut in December.
- Materials stocks fell 5.04% in October as the sector’s sensitivity to global trade makes it vulnerable to tariff uncertainty.


Rates fall, but path is uncertain
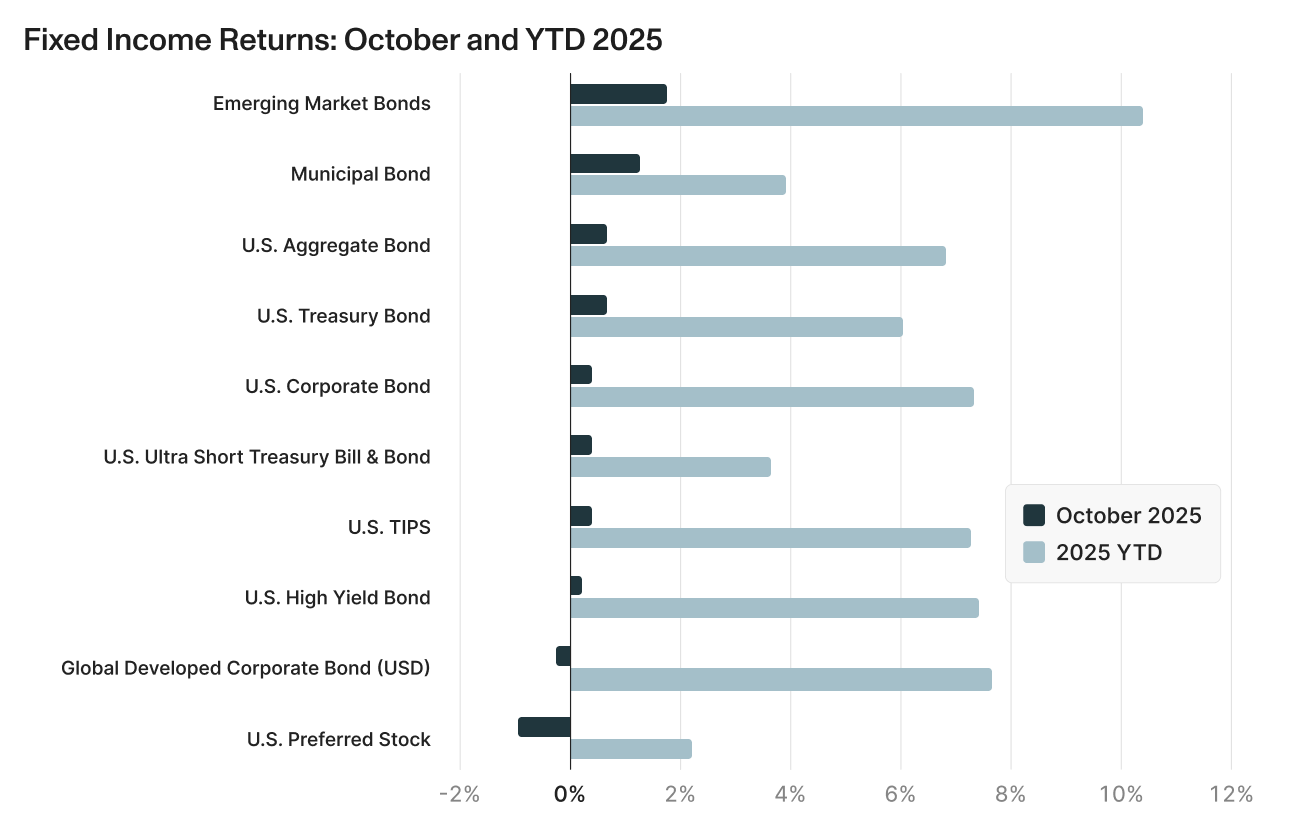
October was a modestly positive month for fixed income markets, with most bond categories posting gains. Investors continued to anticipate further Fed rate cuts, but have now priced in greater uncertainty on the path and ultimate ending point for rate cuts after Powell's comments and the dissenting votes at the latest meeting. The Fed also announced that it will conclude its quantitative tightening program on December 1st, shifting approximately $16.5 billion per month from agency securities into Treasury bills which could support the bill market and bring demand to longer-dated securities.
- Emerging market bonds led again in October and are now up over 10% for the year.
- Credit outperformed duration as strong corporate fundamentals, reduced leverage in the private sector, and lower volatility compared to longer duration government bonds boosted results.
- Municipal bonds continued to rally in October. The solid returns came despite the ongoing government shutdown impacting federal funding and causing rising state and local deficits.
- High yield bonds posted relatively weak returns for the month as extremely tight spreads raised valuation concerns.
Looking forward: Key areas to watch
Credit Cycle
The bankruptcies of subprime auto lender Tricolor and auto parts maker First Brands this month caught investor attention, elevating concerns about broader credit quality deterioration beyond these two specific companies. JPMorgan’s CEO Jamie Dimon’s warning that "when you see one cockroach, there are probably more” grabbed the headlines, but should also be understood in the context that JP Morgan had just taken a $170 million charge on Tricolor losses. The larger question is whether these examples suggest that lending standards have become too loose in general and present a risk to the overall economy. Indeed, the overextension of credit and subsequent defaults has often been a trigger for recession as consumers and businesses reduce their debt levels.
At the Fed press conference following the rate cut on October 29th, Chair Powell was asked specifically if he had concerns about credit conditions. While noting rising defaults in sub-prime automobile credit (the type associated with Tricolor), he said the issue “doesn't seem to be something that has very broad application across financial institutions.” The First Brands and Tricolor issue may be isolated events, but as Chair Powell went on to say, “we're going to be monitoring this quite carefully and making sure that that is the case”.
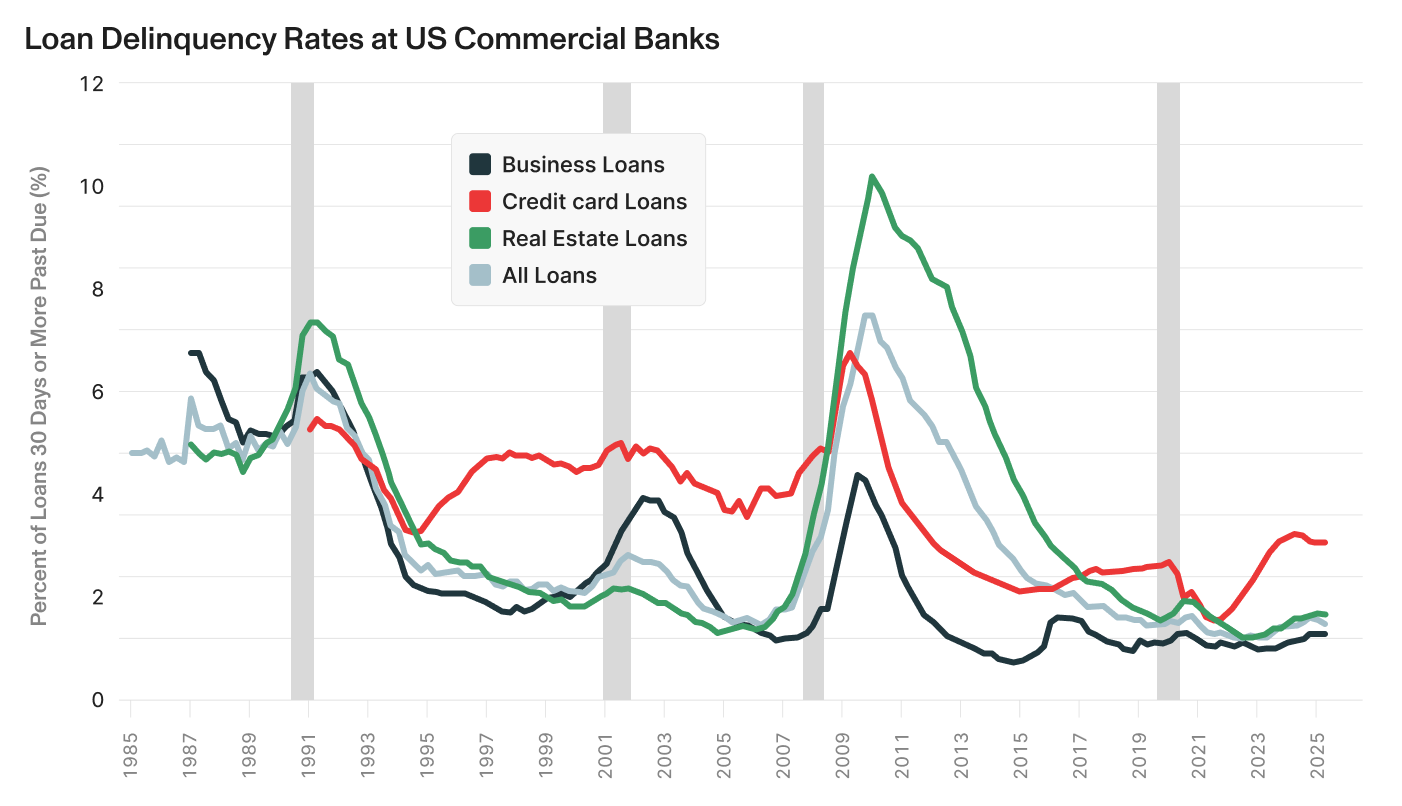
At the moment, credit markets overall do not appear to be worryingly stressed. Delinquencies on consumer, real estate and commercial loans remain very low relative to history.20 Credit card delinquencies have risen from very low levels reached in 2021 as pandemic stimulus money was removed from the system, but have not shown a noticeable increase in the most recent quarters. Other loan categories show a similar pattern — a gradual rise since 2021 but still at the bottom range of the past 40 years. This data comes out only quarterly with the most recent data through June 30. Third quarter data will be released in early November and will bear watching to see if conditions have worsened.
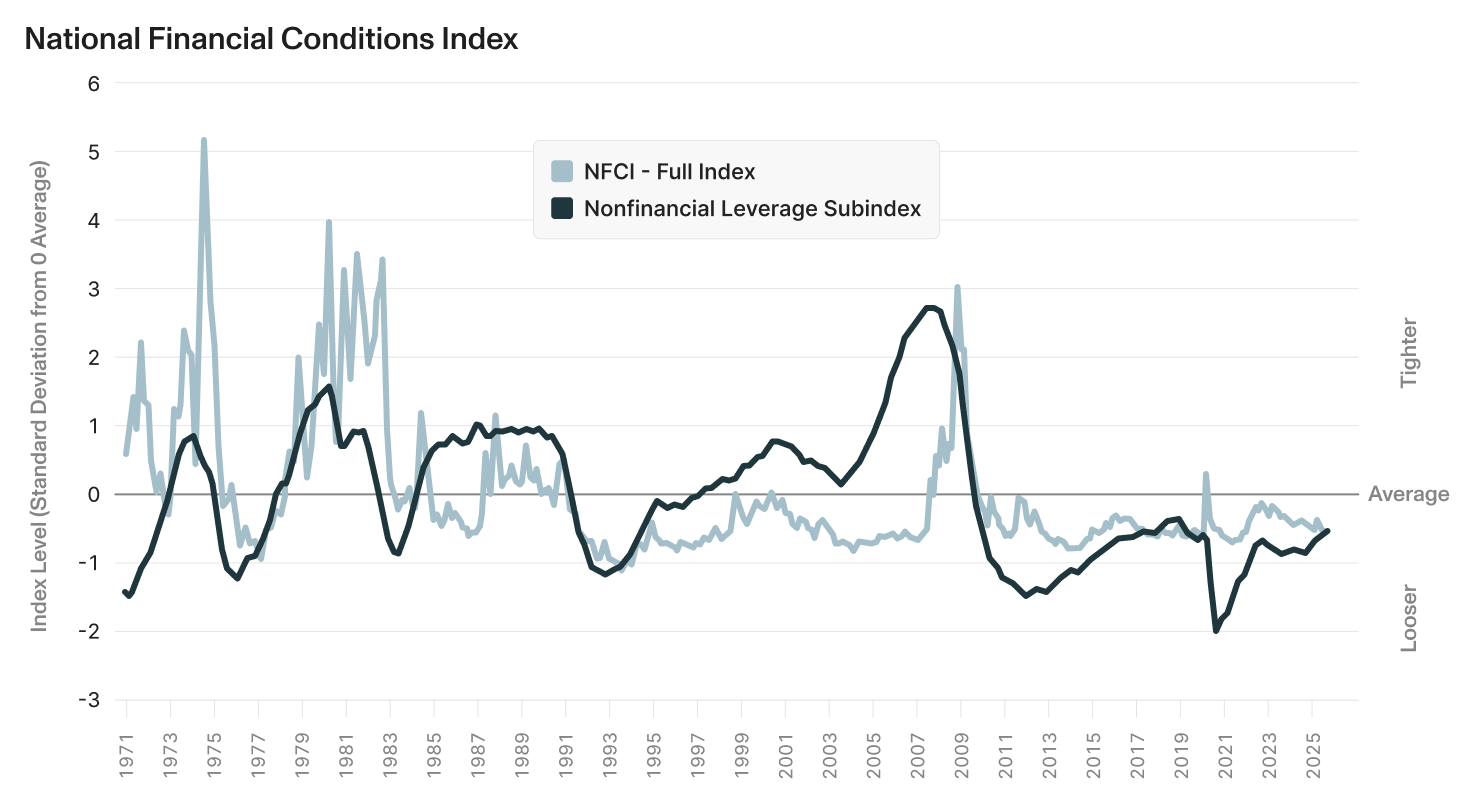
With this relatively benign backdrop, banks and other non bank credit providers have been more than willing to issue loans. Each week, the Chicago Fed publishes its National Financial Conditions Index (NFCI), a comprehensive view on U.S. financial conditions in money markets, debt and equity markets, and the traditional and “shadow” banking systems.22 It measures whether financial conditions are looser or tighter than average. The most recent reading of the index stood at -0.55 on October 24 indicating looser-than-average financial conditions. The NFCI has been in this negative territory (loose conditions) since 2011 with a brief tightening spike in the pandemic and a rise close to average in 2022. Since 2022 financial conditions have become steadily “looser”.
Looking forward, the nonfinancial leverage subindex of the NFCI, which measures household and nonfinancial business leverage, has historically proven to be a reliable early warning indicator of credit cycle shifts, with above-average values preceding most instances of both financial crises and recessions.23 The indicator captures the "financial accelerator" feedback loop between the financial and nonfinancial sectors of the economy. When this index rises (indicating increasing leverage), it signals that tightening financial conditions are associated with rising risk premiums and declining asset values, which reduces the net worth of households and firms at the same time that credit availability tightens. This combination triggers a period of deleveraging (debt reduction) across both sectors that ultimately leads to lower economic activity — the “financial accelerator” loop. In simple terms, this measure tracks whether households and businesses are becoming dangerously overleveraged — a pattern that has preceded past recessions.
The non-financial leverage subindex is currently at -0.53 as of October 24, well below levels historically associated with financial stress, suggesting that despite late-cycle concerns, systemic leverage pressures have not yet reached troubling levels. Still, the measure has risen steadily in the past year.
Beyond these broad measures, concerns have risen in two specific credit market segments: high yield bonds and private credit. While high-yield bonds have posted strong returns in the past several years, credit spreads for the segment are extremely tight. The Bloomberg U.S. Corporate High Yield Index spread sits at just 2.6% above Treasuries, near the all-time tight level of 2.3% and matching levels last seen in May 2007 — just months before the financial crisis. As Aptus Capital Advisors noted, "tight spreads don't just mean low potential returns...they mean no margin for error."24
Private credit has experienced explosive growth in recent years, expanding from approximately $2 trillion in 2020 to $3 trillion at the start of 2025, with projections to reach $5 trillion by 2029.25 This rapid expansion stems from a pull back in traditional bank lending in response to increased bank lending regulations, borrowers' preference for the speed and certainty of private credit, and the floating-rate nature of these loans. The growth in private credit has been accompanied by strong returns, outperforming both leveraged loans and high-yield bonds with higher returns and lower volatility over the past decade. Direct lending posted losses of just 0.4% since 2017, compared to 1.1% for leveraged loans and 2.4% for high-yield bonds.26
However, the Business Development Company (BDC) market signals potential headwinds. BDC stock prices have fallen almost 15% year-to-date and now trade at about 84% of net asset value.27 This discount reflects lowered earnings expectations from Fed rate cuts rather than deteriorating credit quality, but it illustrates how declining rates will structurally lower returns across private credit's largely floating-rate portfolios. After years of benefiting from rising rates, private credit's floating-rate advantage may become a disadvantage.28
The impact will likely depend on the depth of Fed cuts. Morgan Stanley notes that private credit has historically performed well during shallow rate-cutting cycles.29 If cuts remain limited to 100-150 basis points — increasingly likely given Chair Powell's October commentary — private credit may continue delivering compelling returns, particularly in senior secured direct lending with strong credit protections.
Overall, the credit cycle appears late-stage but not yet breaking. Financial conditions remain loose and most borrowers continue servicing debt successfully. However, extremely tight credit spreads and strong flows into private credit suggest minimal margin for error. Like many equity market segments, high yield and private credit markets are priced for perfection.
Credit Cycle — What to look out for:
- Will a slowing of the economy or decline in asset prices lead to an increase in consumer and business loan defaults?
- Is debt and leverage rising to worrying levels?
- Will banks and private lenders tighten underwriting standards?
Earnings growth
The third quarter earnings season has delivered continued strong results, with S&P 500 companies reporting the fourth consecutive quarter of double-digit year-over-year earnings growth.
The blended (combining actual and estimated) earnings growth rate as of October 31 stands at 10.7%, up from 7.9% forecasted at the end of September, marking the ninth consecutive quarter of positive earnings growth for the index. Information Technology and Communication Services continue to account for the majority (60%) of this earnings growth.30
With 64% of companies reporting, 83% of companies have delivered earnings above estimates, the highest percentage since Q2 2021 (87%) and well above the 5-year average of 78%. However, the magnitude of these beats has been more modest at 5.3% above estimates, below the 5-year average of 8.4% and 10-year average of 7.0%.31
Companies have also impressed on the top line, with 79% reporting revenues above estimates (compared to a 5-year average of 70%). Revenues are coming in 2.2% above expectations, and the blended revenue growth rate of 7.9% represents the highest growth since Q3 2022 (11.0%), marking the 20th consecutive quarter of revenue growth.32
Forecasted earnings for 2026 are equally impressive. Analysts expect 12% growth in the first half of the year and 15% growth in the latter half of 2026.33 The over-optimism of analysts is well documented and the current enthusiasm may again prove overstated, but research also suggests that high forecasts for individual companies accurately predict high earners and stock price performance.34 Analysts may get the magnitude wrong, but they often get the direction right. In the current environment, the companies with the highest forecasted earnings continue to be the technology and AI related firms. Even if analysts are correct in forecasting that these companies will continue to deliver market leading earnings growth, it is fair to ask if their current high valuations reflect a growing stock market bubble.
Unlike historical technology bubbles, the stock price appreciation of the current technology sector leaders has been driven primarily by fundamental growth rather than speculation about future growth.35 These companies have achieved staggering profit growth over the past fifteen years with particularly strong balance sheets. Most importantly, earnings momentum has been a large driver of recent prices, suggesting the rally is justified by fundamentals but also highly dependent on continued earnings performance.
Another important difference from past bubbles is that leading AI companies today finance most capex through free cash flow rather than debt, maintaining exceptionally strong balance sheets.36 Still, it remains to be seen if cash flow alone will be sufficient to finance the soaring investment needs. Goldman's credit strategists note a shift toward debt financing as cash reserves dry up, with $141 billion in corporate credit issued by their basket of AI related technology companies so far in 2025.37
The strong Q3 earnings performance and optimistic forecasts for 2026 provide fundamental support for both the overall equity market and, importantly, elevated technology valuations. Still, the market is priced for continued strong execution and the margin for error on earnings delivery is minimal.
Earnings — What to look out for:
- Can investors see evidence that AI capex spending is translating into revenue and profit growth?
- Will consumer spending hold up and allow companies to hit ambitious 2026 earnings targets?
- Do financial companies report any deterioration in loan performance and the beginning of tightening standards?
Navigating the Path Forward
As we look ahead to the final months of 2025 and into 2026, the investment landscape presents a study in contrasts.
On one hand, fundamental support for risk assets remains solid. Corporate earnings are growing at double-digit rates, Q3 economic growth is tracking near 4%, the Fed continues to ease monetary policy and the dominant technology and AI-related companies have delivered extraordinary profit growth.
On the other hand, many market segment appears priced to perfection. Equity valuations are stretched by historical standards, high-yield credit spreads are at record tight levels and bankruptcies at two higher profile private credit borrowers raised concerns about the credit cycle.
Investors would be wise to monitor closely the two key areas we highlighted this month: whether the credit cycle can remain benign if the economy slows, and whether corporate earnings, especially for the leading technology and AI companies, can continue to meet or exceed ambitious expectations.
The path forward requires both optimism about fundamental strength and prudence about stretched valuations.
Compound provides everything you need to manage your finances (liquidity planning, concentrated position management, stock option optimization, and more).
[1] https://www.spglobal.com/spdji/en/index-family/equity/
[2] https://fred.stlouisfed.org/series/DGS10
[3] https://www.theguardian.com/business/2025/oct/18/what-is-private-credit-us-first-brands-tricolor-banks
[4] https://finance.yahoo.com/news/jamie-dimon-warned-of-cockroaches-in-the-financial-system-fed-chair-powell-doesnt-see-a-broader-problem-140936956.html?guccounter=1&guce_referrer=aHR0cHM6Ly93d3cuZ29vZ2xlLmNvbS8&guce_referrer_sig=AQAAALJaqxo1qVJWGz26bRtHSO81MQb5FiozZ4CHJSoMLk0fdtzFyvnlyo8VB08z9yYtBGjM8ZlQ-lMMM4qgIKABZFFKVBLUcL6sZv5xP4BAOWJ2ZYCZjR3ec1sXAAUfEN4Swogxmr8pMJW8QM8xYNB7vIvcOk_i6h2GYrlj-2Qkbx
[5] https://www.cnbc.com/2025/10/10/trump-trade-tariffs-china-software.html#:~:text=President%20Donald%20Trump%20said%20the,any%20and%20all%20critical%20software.%22
[6] https://www.reuters.com/world/china/looming-trump-xi-meeting-revives-hope-us-china-trade-truce-2025-10-29/
[7] https://www.federalreserve.gov/newsevents.htm
[8] https://bilello.blog/2025/the-week-in-charts-10-29-25?utm_source=charlies-newsletter-88171d.beehiiv.com&utm_medium=newsletter&utm_campaign=the-week-in-charts-10-29-25&_bhlid=e778b88247d0c58d0ef0b1d95a33ed1ae1d320bc
[9] https://www.bls.gov/news.release/cpi.nr0.htm
[10] https://share.google/KIwls6Gj4URhLfZQk
[11] https://www.atlantafed.org/cqer/research/gdpnow
[12] https://insight.factset.com/topic/earnings
[13] https://bilello.blog/2025/the-week-in-charts-10-29-25?utm_source=charlies-newsletter-88171d.beehiiv.com&utm_medium=newsletter&utm_campaign=the-week-in-charts-10-29-25&_bhlid=e778b88247d0c58d0ef0b1d95a33ed1ae1d320bc
[14] https://www.spglobal.com/spdji/en/index-family/equity/
[15] https://www.spglobal.com/spdji/en/index-family/equity/
[16] https://www.spglobal.com/spdji/en/index-family/equity/
[17] https://www.msci.com/end-of-day-data-search
[18] https://www.nasdaq.com/market-activity/index/comp/historical
[19] https://www.spglobal.com/spdji/en/index-family/equity/
[20] https://www.federalreserve.gov/releases/chargeoff/delallsa.htm
[21] https://www.federalreserve.gov/releases/chargeoff/delallsa.htm
[22] https://www.chicagofed.org/research/data/nfci/current-data
[23] https://www.chicagofed.org/publications/chicago-fed-letter/2012/december-305
[24] https://aptuscapitaladvisors.com/narrow-spreads/
[25] https://www.morganstanley.com/ideas/private-credit-outlook-considerations
[26] https://www.morganstanley.com/ideas/private-credit-outlook-considerations
[27] https://pitchbook.com/news/articles/rate-cuts-of-100-bps-could-lower-bdc-earnings-by-7-2-oppenheimer
[28] https://pitchbook.com/news/articles/rate-cuts-of-100-bps-could-lower-bdc-earnings-by-7-2-oppenheimer
[29] https://www.morganstanley.com/ideas/private-credit-outlook-considerations
[30] https://insight.factset.com/topic/earnings
[31] https://insight.factset.com/topic/earnings
[32] https://insight.factset.com/topic/earnings
[33] https://insight.factset.com/topic/earnings
[34] Michel, Jean-Sébastien, and Pandes, J. Ari. "Are Analysts Really Too Optimistic?"
https://share.google/JI4QmsDFLtDzFi6RF
[35] https://www.goldmansachs.com/insights/articles/why-global-stocks-are-not-yet-in-a-bubble
[36] https://www.goldmansachs.com/insights/articles/why-global-stocks-are-not-yet-in-a-bubble
[37] https://www.goldmansachs.com/insights/articles/why-global-stocks-are-not-yet-in-a-bubble