The only certainty is uncertainty

Compound is a digital family office for entrepreneurs, professionals, and retirees who want the personal touch of a dedicated advisor accompanied by a beautiful digital experience.
Investing is always about balancing expected returns and risks for assets. The challenge is that those dimensions are inherently hard to predict given imperfect data and forecasting models that struggle to capture shifting relationships that are heavily influenced by human behavior. As much as we try, it is difficult to find stable patterns of economic and market dynamics — it’s just not physics. Still, these uncertainties create differences in outlooks that in turn generate the opportunities for investors to distinguish themselves.
As July unfolded, it felt like investors were getting more clarity on trade and budget policies that had been a source of heightened uncertainty earlier in the year:
- Tariffs were coming in at lower levels than initially feared and trade deals were announced between the US and other countries.
- The “One Big Beautiful Bill” was passed, providing a roadmap for fiscal policies and tax rules.
- The Fed’s “data dependency” focus was understood as delaying interest rate cuts.
But, the last week of the month (and the first day of August) brought a reminder that things can change quickly. Investors were spooked by:
- Announcements of higher tariffs on many countries where trade deals hadn’t been reached.
- Escalating pressure on Fed chair Powell (including threats of firing him).
- Sharp downward revisions to employment growth (and the actual firing of the head of the Bureau of Labor Statistics).
These developments present risks and opportunities in several key areas that we will dig into, but first…
Last month at a glance
- Market Performance: Equity markets had an excellent July with many indices reaching multiple record highs, bolstered by solid earnings and some initial trade optimism.1 Bond returns were mixed, with treasuries hurt by rising longer term interest rates.2
- IPO Rebound: New public listings continued to rebound from weak levels of the past several years, with IPOs in the first half of 2025 up 16% from year-end levels and June showing some especially large deals with increasingly strong after market performance.3 IPO momentum has continued into Q3, with Figma’s July 31 listing and its 250% day 1 price “pop” an example of the strength of investor appetite for new technology companies.4
- Trade Policy Developments: Trade deals with Japan and the Philippines, plus initial agreements with the EU, provided additional optimism. However, President Trump's escalating tariff threats (raising Canada tariffs to 35% and warning of 15-20% blanket tariffs) created some volatility to end the month.
- Fiscal Policy: The "One Big Beautiful Bill Act" was signed into law on July 4th, shifting government spending priorities and creating an expected increase in the deficit of $3.4T over the next decade.5 The bill made substantial changes to tax policies, locking in existing lower rates and introducing new tax rules that Kristen Carter, our Head of Tax Advisory, covered in detail in her recent post.
- Federal Reserve: The Fed left interest rates unchanged at its July meeting as Chair Powell said that economic uncertainty “remains elevated”.6 For the first time in 30 years, two members of the FOMC dissented, voting for a 25bp cut in rates.7 8
- Economic Data: Reports released in July showed some increase in overall inflation and the first signs of the impact from tariffs with apparel and home furnishing prices rising.9 Employment growth was weaker than expected in June and revised down sharply for April and May, but the unemployment rate was little changed.10 Initial Q2 GDP growth swung substantially from Q1, reflecting companies adjusting spending ahead of tariffs, but overall growth for the first half of the year was lower than the 2024 pace.11
- Earnings: Q2 earnings have come in relatively strong fueled by continued exceptional results from the leading AI related companies.12
Stocks continue to push higher
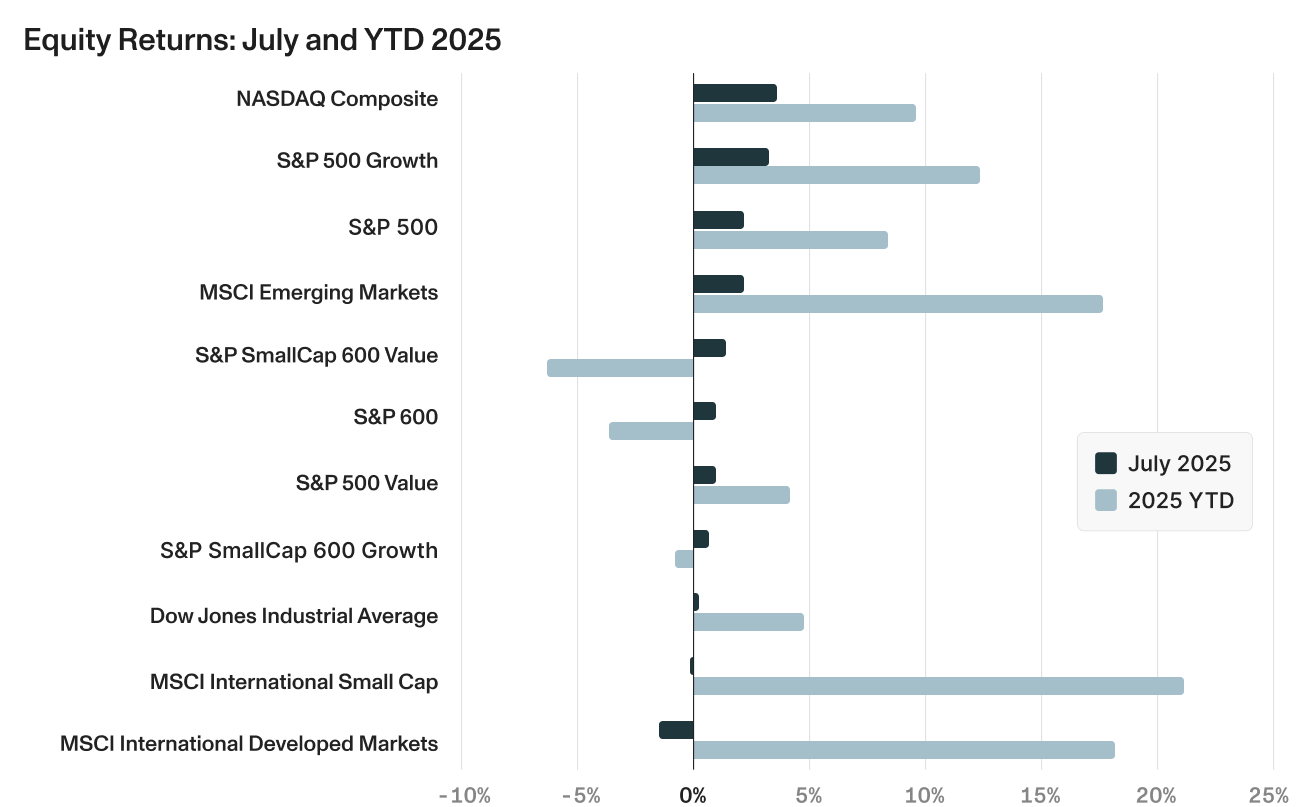
Equity markets built on their Q2 rebound with US large cap indices posting several record highs.13 Passage of the budget bill as well as trade deals bolstered investor optimism until the last week of the month when escalating tariff threats returned and stocks sold off for the three consecutive days. Strong earnings from several bellwether technology companies also provided support for rising tech stock prices.14
- Growth stocks continued to outpace value counterparts, with the S&P 500 Growth rising 3.43% in July versus just 0.89% for the S&P 500 Value.15
- The NASDAQ led all major indices with a strong 3.72% gain in July, reflecting continued strength in technology stocks.16
- Small-cap stocks rose 0.93% for the month, continuing to lag large cap stocks and still showing negative returns year-to-date (-4.46%).17
- International markets were mixed with developed market large and small cap stocks falling in July while emerging markets rose over 2%.18
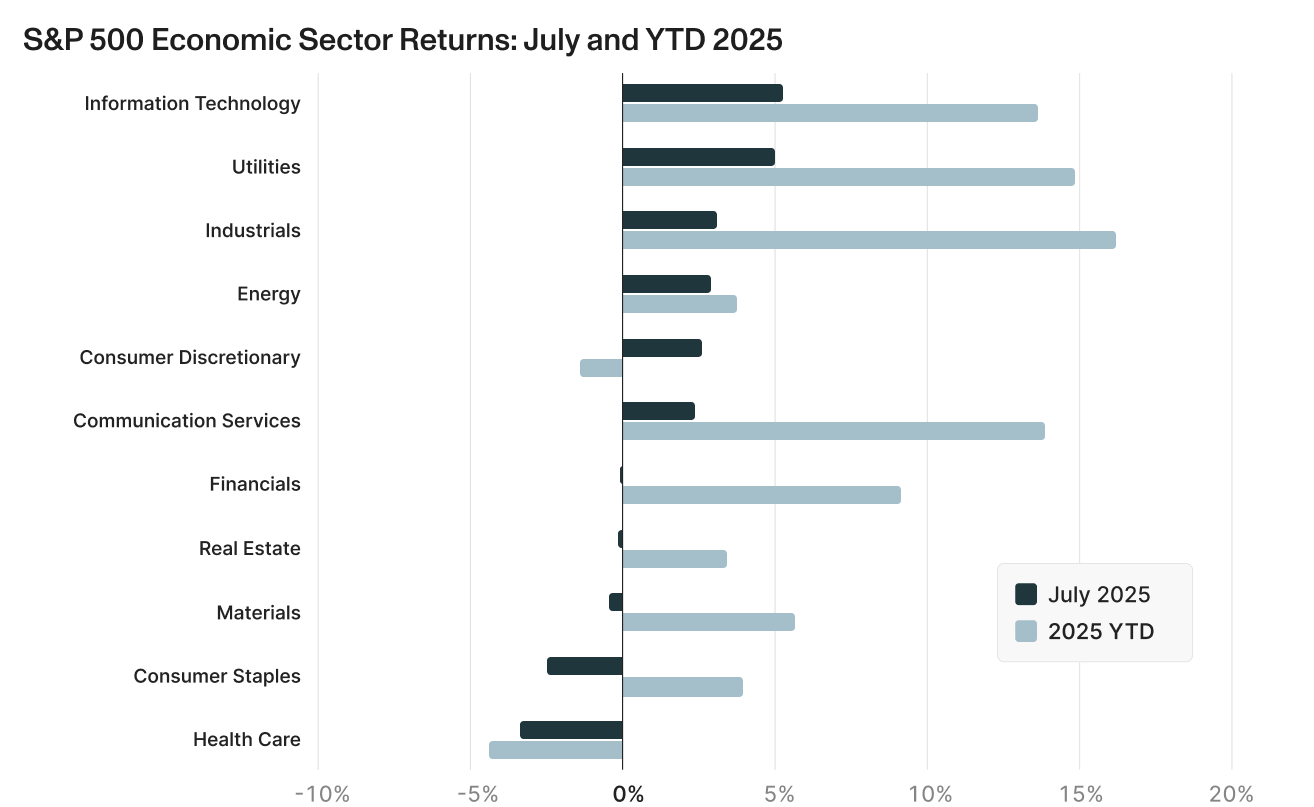
- Sector performance was split within the S&P 500, with technology and cyclical sectors rising while more defensive sectors declined.19
- Information Technology again led all sectors, rising over 5% for the month.
- Energy and utility stocks rebounded after a weak first half of the year.
- The defensive staples and health care sectors were the weakest performers in July.
Riskier and shorter duration fixed income leads
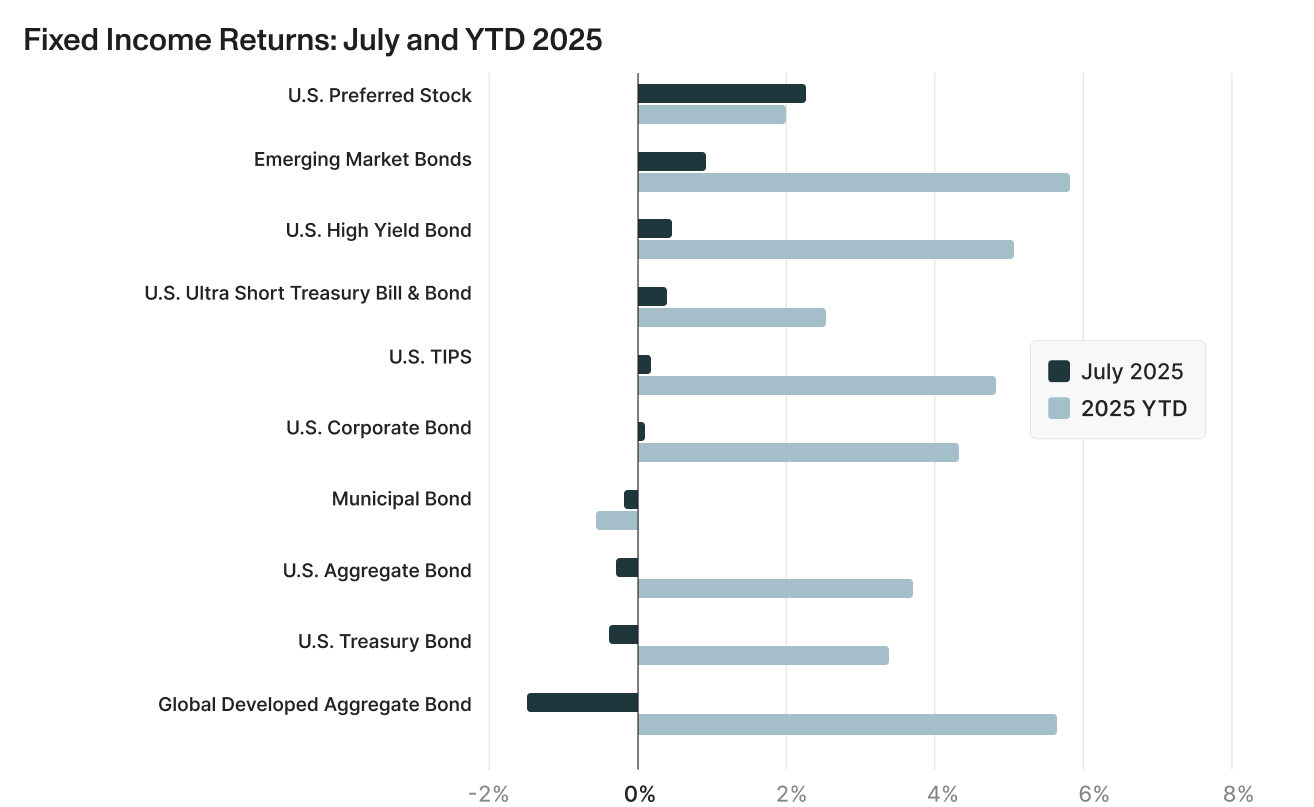
July's fixed income markets showed a clear preference for credit over duration and domestic over international exposure.24
- U.S. Preferred Stock led with 2.24% returns, benefiting from both credit exposure and equity-like characteristics during the risk-on environment.
- U.S. High Yield Bonds (+0.45%) outperformed investment grade corporates (+0.07%), as investors remained comfortable taking credit risk.
- U.S. Ultra Short Treasury Bills & Bonds (+0.37%) significantly outperformed longer-duration Treasuries (-0.39%)
- Municipal Bonds (-0.20%) continued to underperform as the market works off heavy issuance earlier in the year and some concerns on state finances from shifting Medicaid costs to the states.
- Like in equities, international results were mixed with developed market bonds falling 1.49% while emerging markets bonds rose 0.92%.
Looking forward: Key areas to watch
1. The Fed dual mandates
Mandate #1 Low Inflation: Tariff impact offsetting declining trend
As it has done at each Federal Open Market Committee (FOMC) meeting this year, the Fed kept the target fed funds rate unchanged in July. This despite building external pressure to cut rates from President Trump and two dissenting votes from Board members Bowman and Waller favoring a 25bp cut. The challenge as Powell and the majority of the FOMC see it is that inflation has been running above the target 2% rate for several years and the latest core Personal Consumption Expenditures price index showed inflation at 2.54% from a year ago.25
Although Chair Powell indicated that inflation remains above target even excluding tariff impacts, those impacts remain highly uncertain and are just starting to show up in goods prices. The most recent CPI report for June showed several tariff sensitive categories posted notable increases from May, with apparel up 0.4% after falling in the prior two months, and household furnishings up 1% after rising just 0.3 and 0.2% in May and April, respectively. Even though the impact of tariffs on inflation is acknowledged to be temporary, distinguishing between those one-time effects and underlying inflation trends creates a challenge for the Fed.
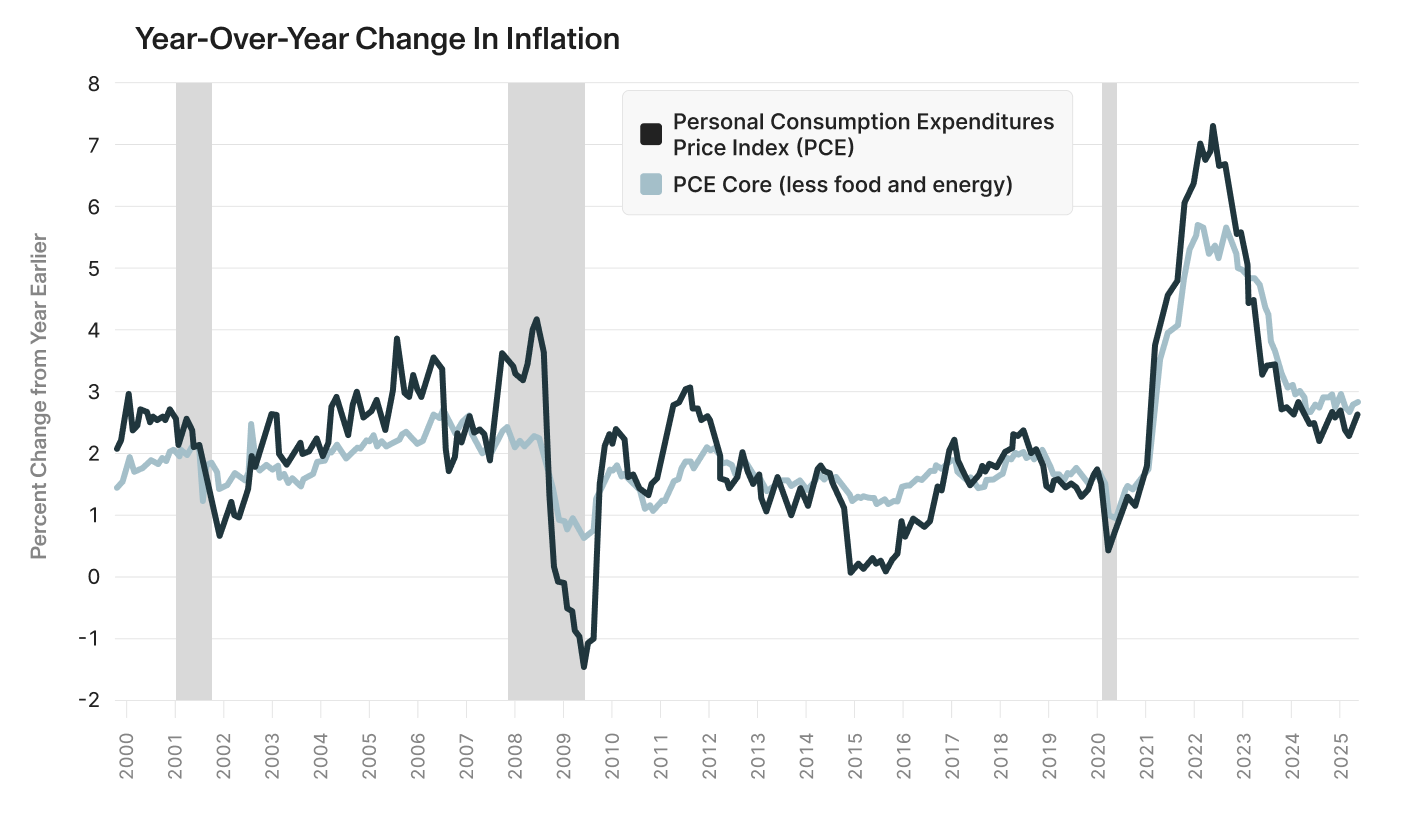
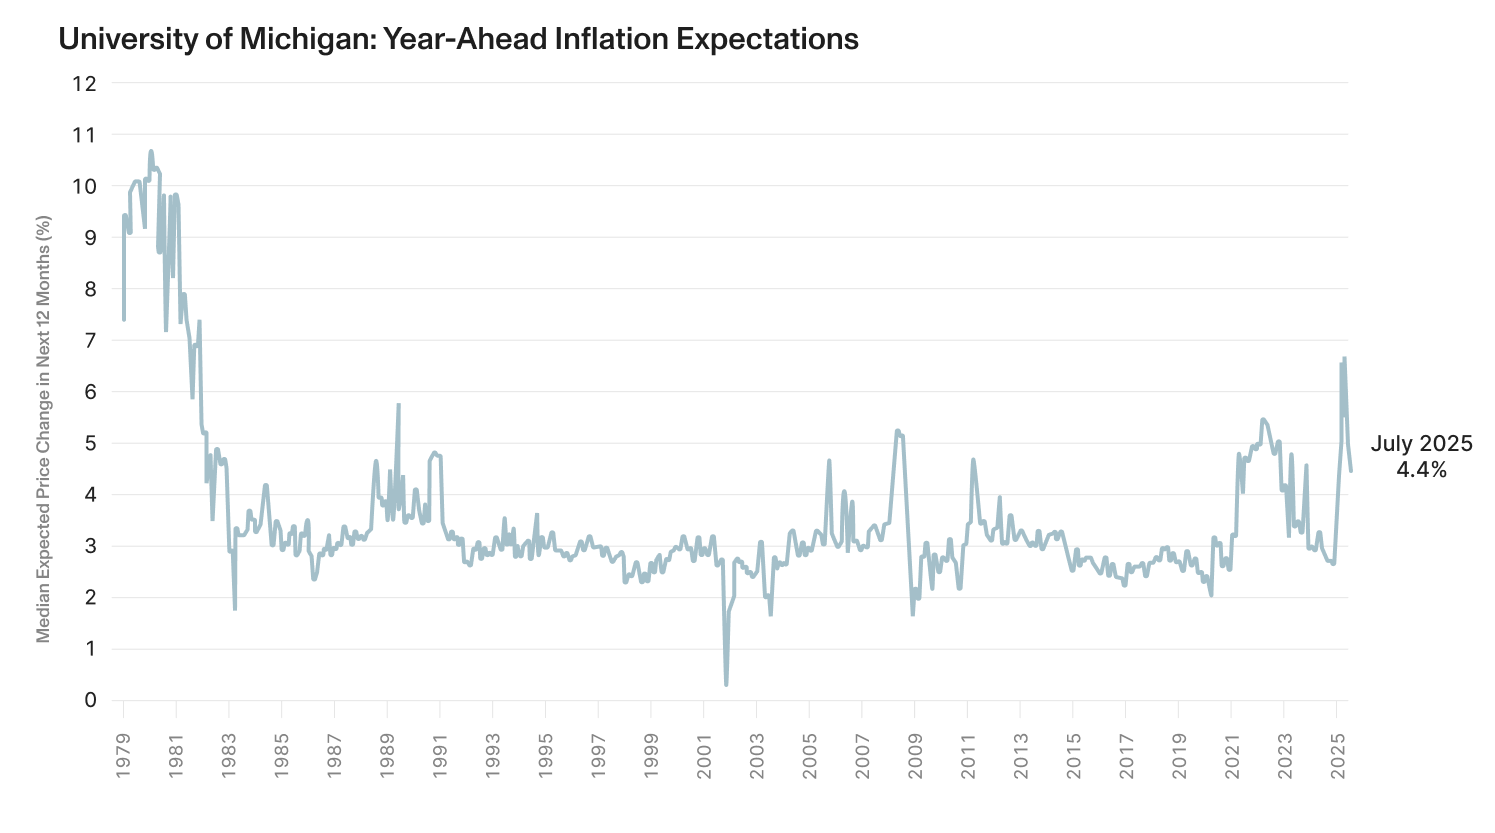
One dimension of inflation that most concerns the Fed is when consumers, workers and businesses lock in on higher inflation expectations. When expectations for rising prices are anchored above the Fed’s target rate, it can create a self-fulfilling feedback loop that makes it more difficult for the Fed to bring inflation back down to target levels. On this front, concerns that tariffs will increase prices pushed up consumers' expectations for near-term inflation to 6.6% in May from 2.8% at the end of 2024.27
As tariffs were delayed and trade deals materialized with lower rates than initially announced, year-ahead inflation expectations have declined. The University of Michigan’s July survey showed that inflation expectations fell for a second straight month, dropping to 4.5% from 5% in June. This is the lowest reading since February 2025 but above December 2024 just after the election. Long-run (5-year ahead) inflation expectations receded for the third consecutive month, falling back to 3.4% in July from 4.0% in June. This is the lowest reading since January 2025 but, again, still considerably higher than the December 2024 reading.
Mandate #2 Full Employment: Slowing job growth but low unemployment
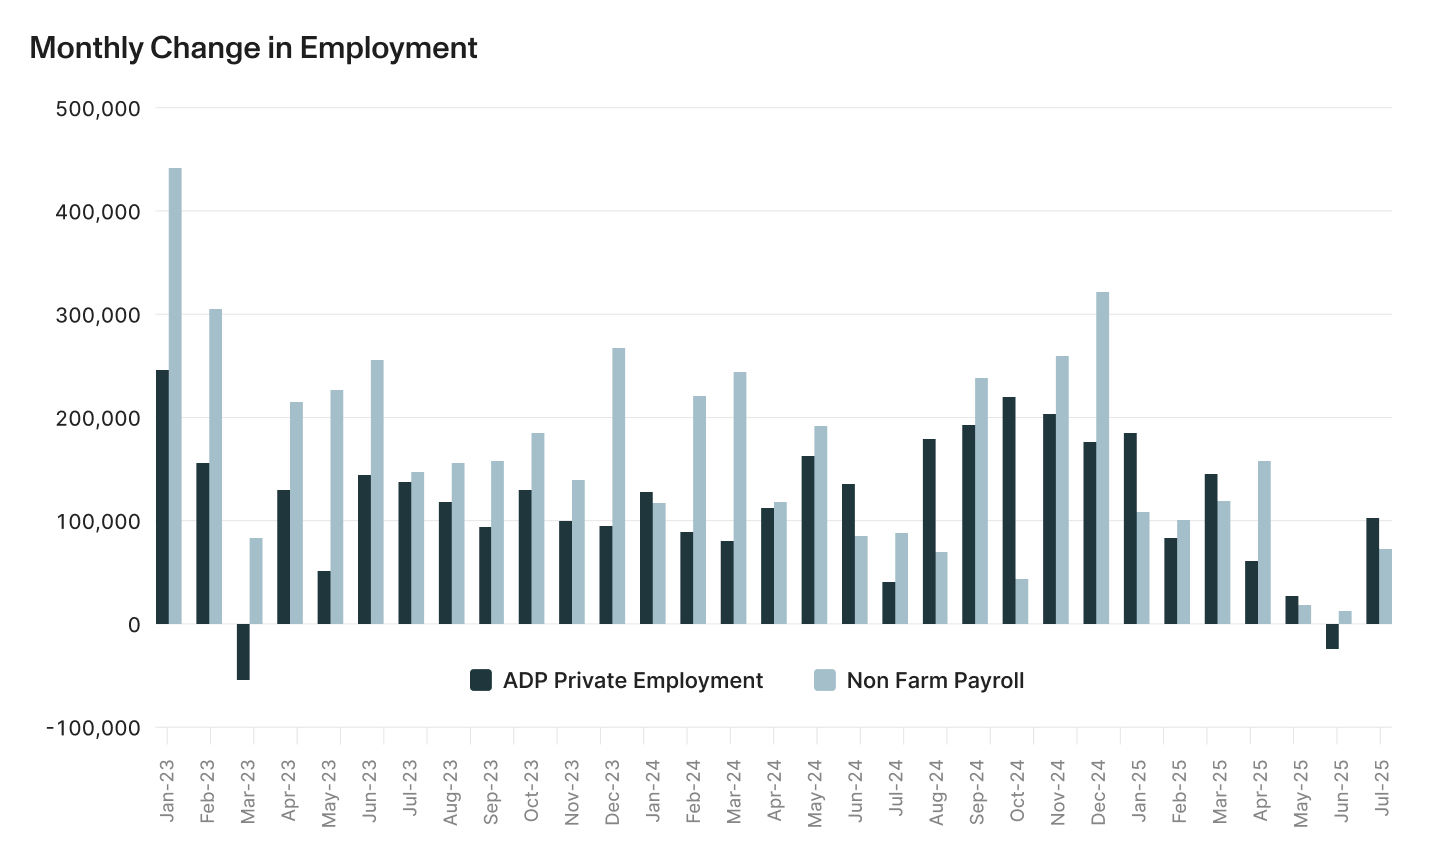
The second half of the Fed’s dual mandate is to maintain full employment. Although Chair Powell described the labor market as “solid” and "in balance," in support of the decision to leave interest rates unchanged, the July payroll employment report released on August 1, showed only 73,000 jobs added and substantially lowered job gains reported previously for May and June.29 30
Other measures of employment have also painted a picture of a weakening job market. The number of individuals who have been out of work for more than 27 weeks climbed to 1.82 million, the most since December 2021. The share of unemployed Americans who are long-term unemployed — meaning they've been out of work for more than six months — has increased to nearly 25% from 21.6% a year ago. The Job Openings and Labor Turnover Summary (JOLTS) can be volatile, but the general trend for the first half of this year has been that hiring and job openings are down and layoffs are up relative to the first half of 2024.31
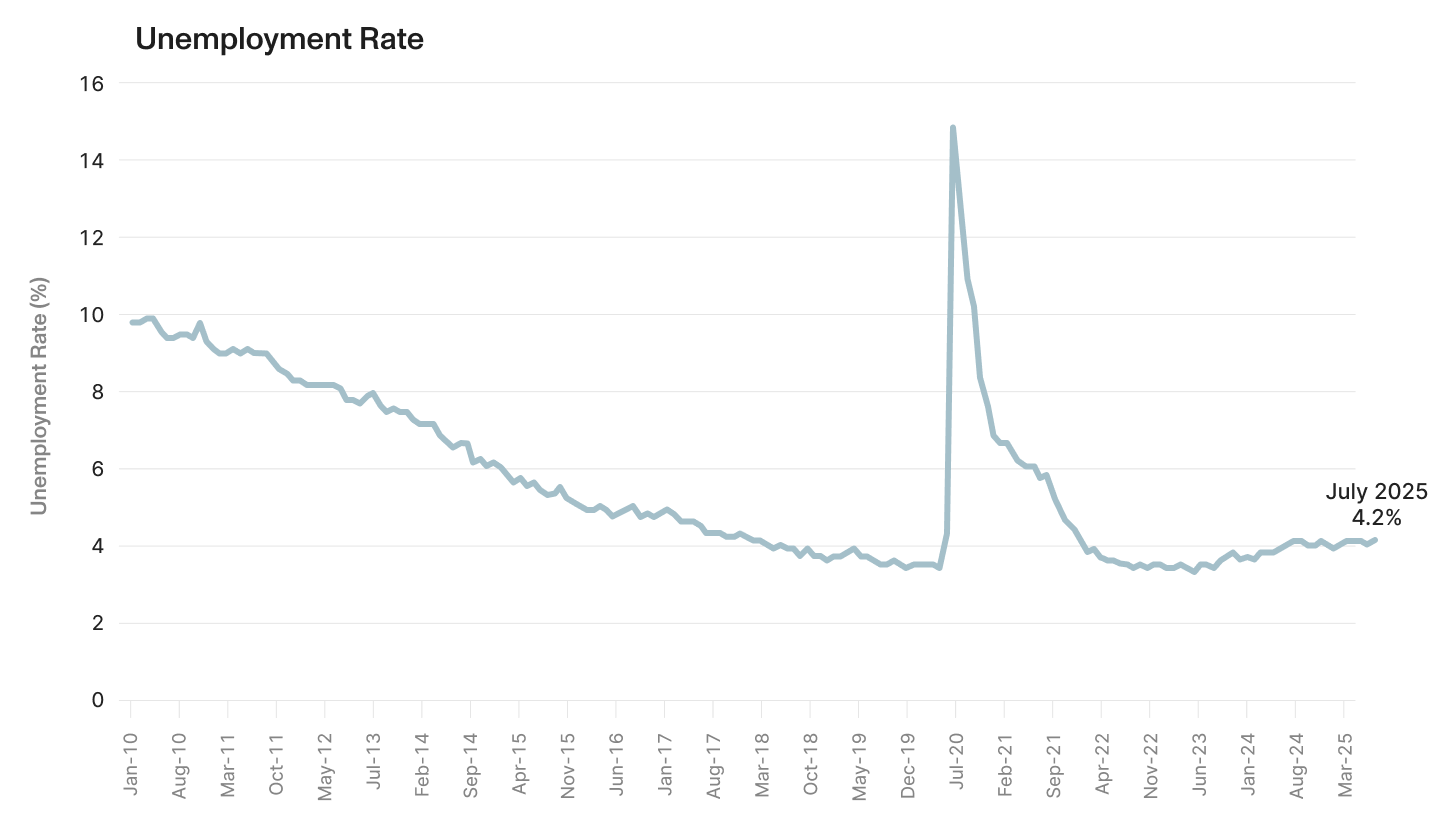
The assessment of “full employment” is better captured by the unemployment rate than job growth. On that one measure, the situation has changed little in the past year, with the unemployment rate hovering between 4 and 4.2% for the last 15 months. Even with somewhat slower job gains this year, a declining labor supply has allowed the unemployment rate to remain low. In the past 3 months, the labor force has declined by almost 800,000 as a result of an aging population, increased immigration enforcement and discouraged unemployed workers leaving the workforce.34
The decline in the workforce has important implications for how investors and policy makers view the level of job growth that represents a growing economy. With US population growth slowing sharply in the past year and a half, fewer jobs are needed to keep up with the growth of the labor force. In a recent study, Jed Kolko, a senior researcher at the Petersen Institute of International Economics, estimates that the breakeven rate of monthly payroll growth in the jobs report needed to keep up with the labor force has fallen from 166,000 jobs in early 2024 to 86,000 jobs in June 2025.35 If that estimate is indeed correct, then the 73,000 jobs added in July may be consistent with the “solid” employment picture that Fed chair Powell sees.
The Fed dual mandates — What to look out for:
- It is likely that inflation in the next few months will remain above target and the impact from tariffs will continue to slowly show up in the data. That will lead to continued hesitancy for the Fed to lower rates in September.
- Which means the employment picture will be the key determinant of whether the Fed lowers rates in September. The revisions to the recent job numbers reflect a complicated process of estimating employment trends, but if the August unemployment rate (released on September 5th) shows an increase, that will likely be enough to lead the Fed to cut rates at its next meeting on September 16-17.
2. Signs of slowing growth
GDP swings mask weaker growth
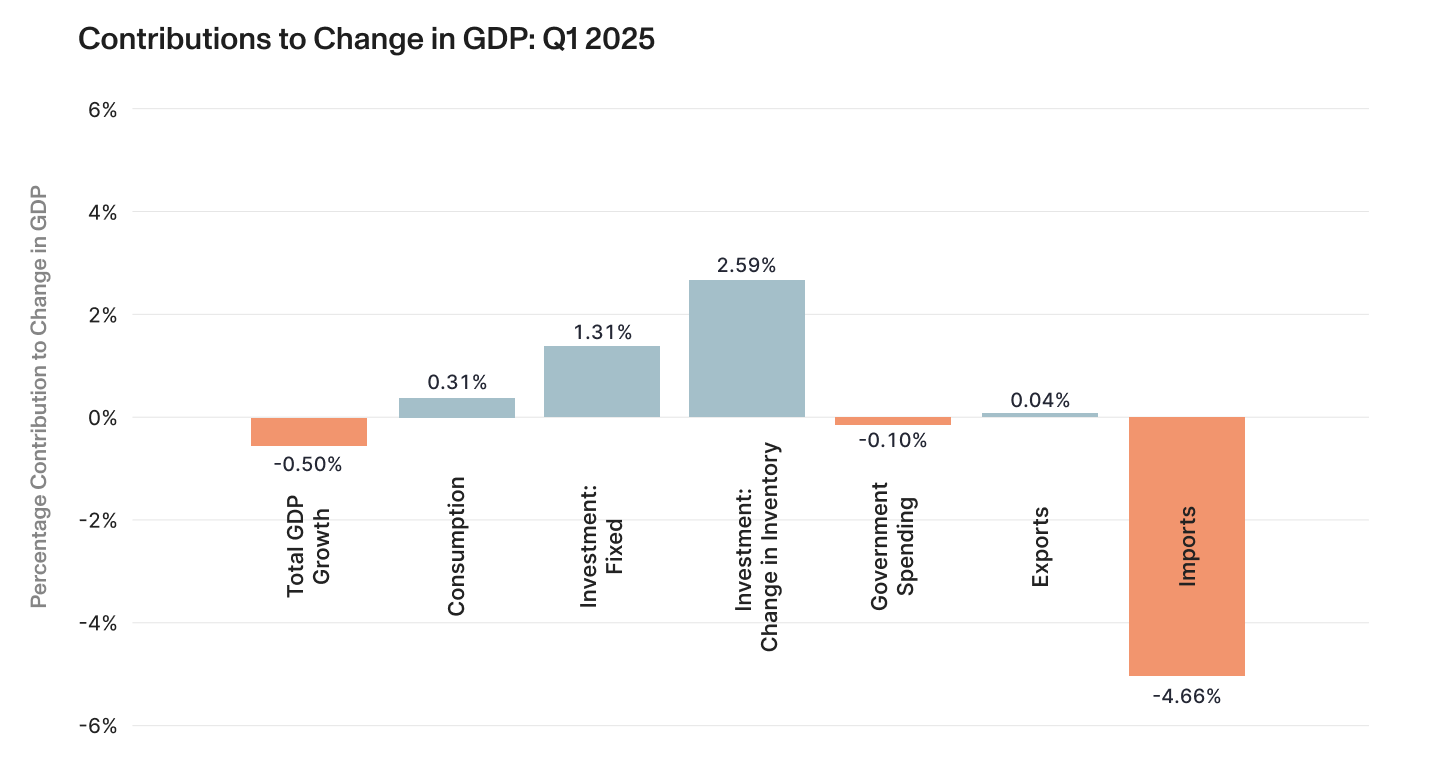
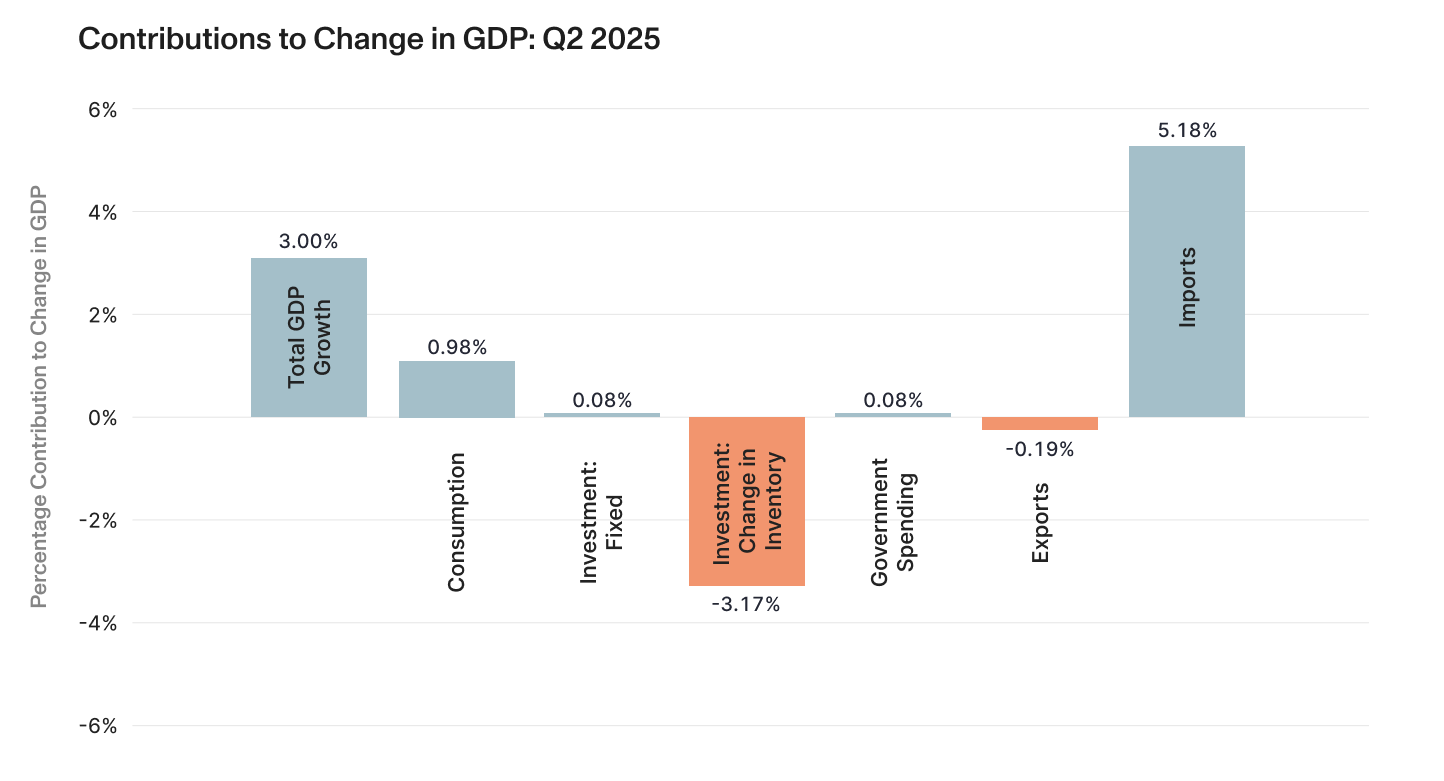
The most recent GDP release showed strong 3% growth for the second quarter.37 This followed declining GDP growth in Q1. The unusually large swings were the direct result of corporations adjusting for the expected impact of tariffs (“front running”) in Q1. The Q1 results below show the substantial surge in imports during the quarter (imports show up as a negative contribution to GDP). Most, but not all, of those imports filled inventories as companies loaded up on products before the tariffs took hold. These behaviors were widely and appropriately viewed as one-time adjustments to changing tariff policy. The -0.5% drop in GDP for the quarter was not seen as reflecting the underlying condition of the economy.
It was also widely expected that the Q1 patterns would adjust in the opposite direction almost equally in Q2. The chart below shows that is exactly what happened. In the Q2 GDP report, we see a sharp drop in imports (again, showing the opposite sign) and substantial reductions in inventories. Just like in Q1, the total GDP growth for the quarter was not seen as an indicator of growth.
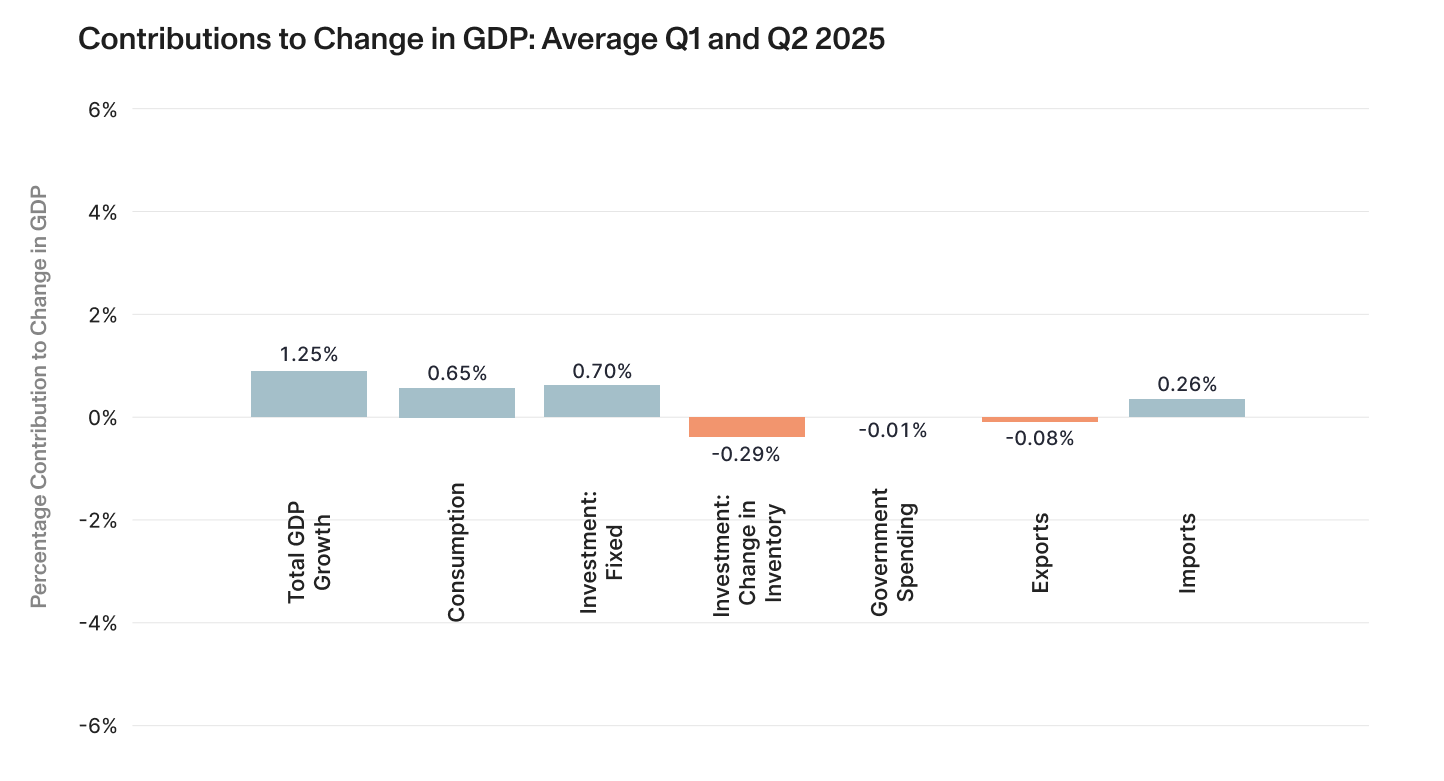
To get a clearer picture of how the economy has been growing in the first half of the year, it’s better to take the average of Q1 and Q2 GDP reports. The chart below shows that average plotted on the same scale as the prior two charts. You can see that the swings in imports and inventories over Q1 and Q2 largely cancel each other out. The total growth in GDP in the first half of the year (expressed at an annual rate) is more reasonably shown to be 1.25%.
This growth rate marks a reduction in the 2.8% growth in 2024 and the 2.9% growth in 2023. As consumption accounts for about two-thirds of US GDP, the relatively sluggish growth in consumption is the primary reason for the subdued overall growth so far this year. The 0.65% average annual growth in consumption in the first half of 2025 is well off the 2.04% average growth seen in 2023 and 2024.40
How long can consumers keep it up?
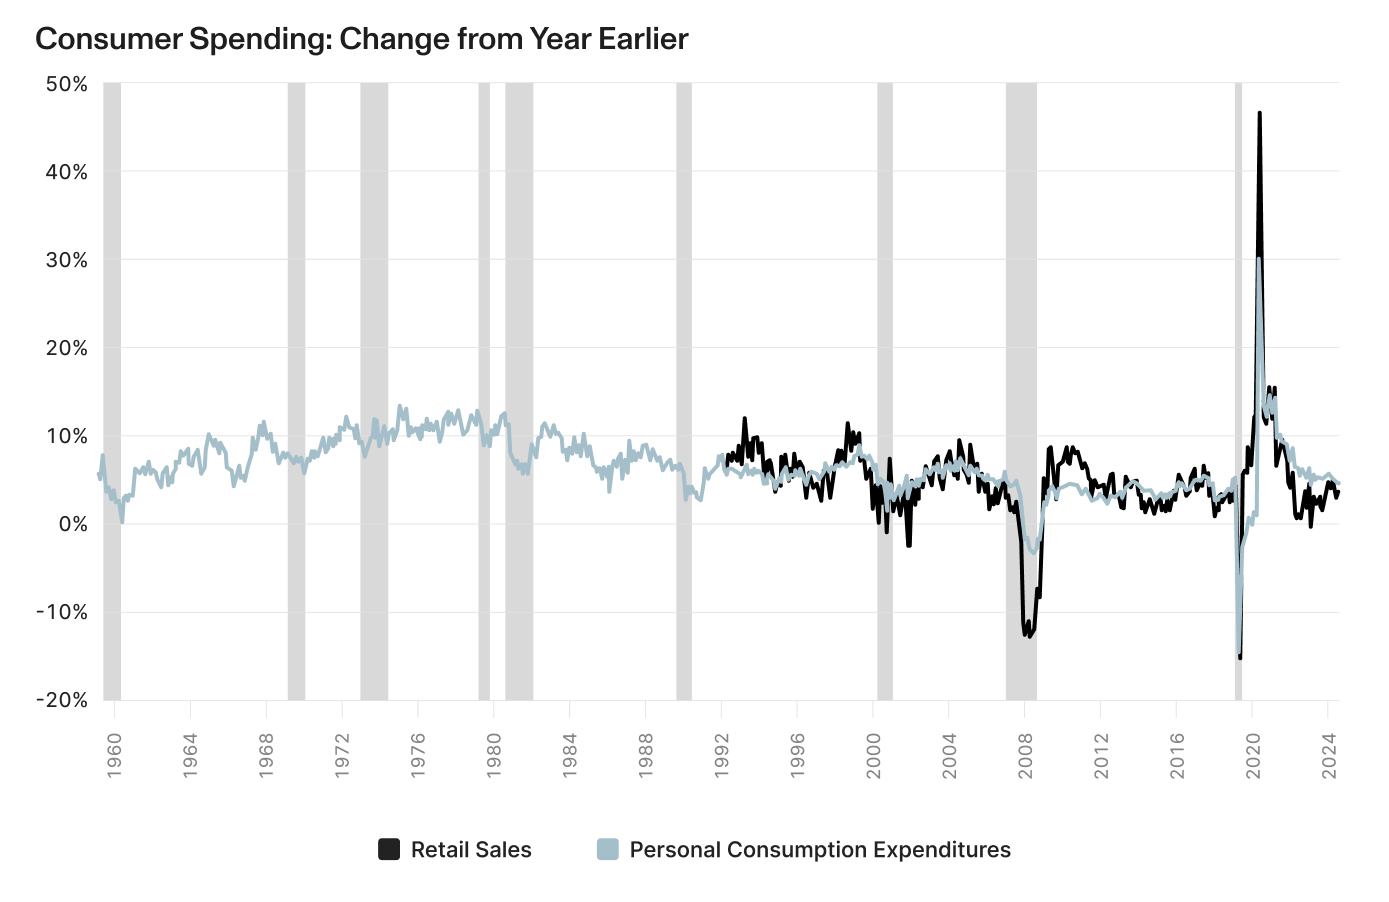
While the GDP data suggests some slowing in consumption, other sources of spending data show a more resilient consumer. Both Personal Consumption Expenditures and retail sales growth from a year earlier have softened slightly recently, but are close to pre-pandemic levels. Consumer balance sheets remain healthy with a 9:1 asset-to-liability ratio and $50 trillion in household net worth growth since the pandemic. Despite rising debt levels, the debt service ratio at 11.2% remains manageable and below pre-2020 averages.42 Delinquencies on auto loans and credit cards improved slightly in the latest readings (Q1); however, the delinquency rate for student loans surged from below 1 percent to nearly 8 percent, as the pause on reporting delinquent federal student loans ended.43
Overall, consumer spending appears stable but is evolving as consumers adjust to expectations on the impact from rising tariffs. Front-loaded goods purchases (electronics, appliances) rose in the spring, but have since come back down.44 The typically cyclical travel spending has declined meaningfully over the course of the year.45 A decline in foreign travelers explains part of the decline, but most of it is explained by cutbacks from domestic households. As sentiment improved and equity markets recovered on easing of the worst tariff fears, discretionary travel spending has stabilized.
Slowing growth — What to look out for:
- Companies have only just started to pass on tariff costs through higher prices. When that expands, consumers are likely to seek value and shift consumption patterns towards staples and away from discretionary goods.
- With household balance sheets in good shape, the biggest risk to consumer spending is a deterioration in the employment picture.
3. Corporate earnings
Expectations recover on continued AI strength
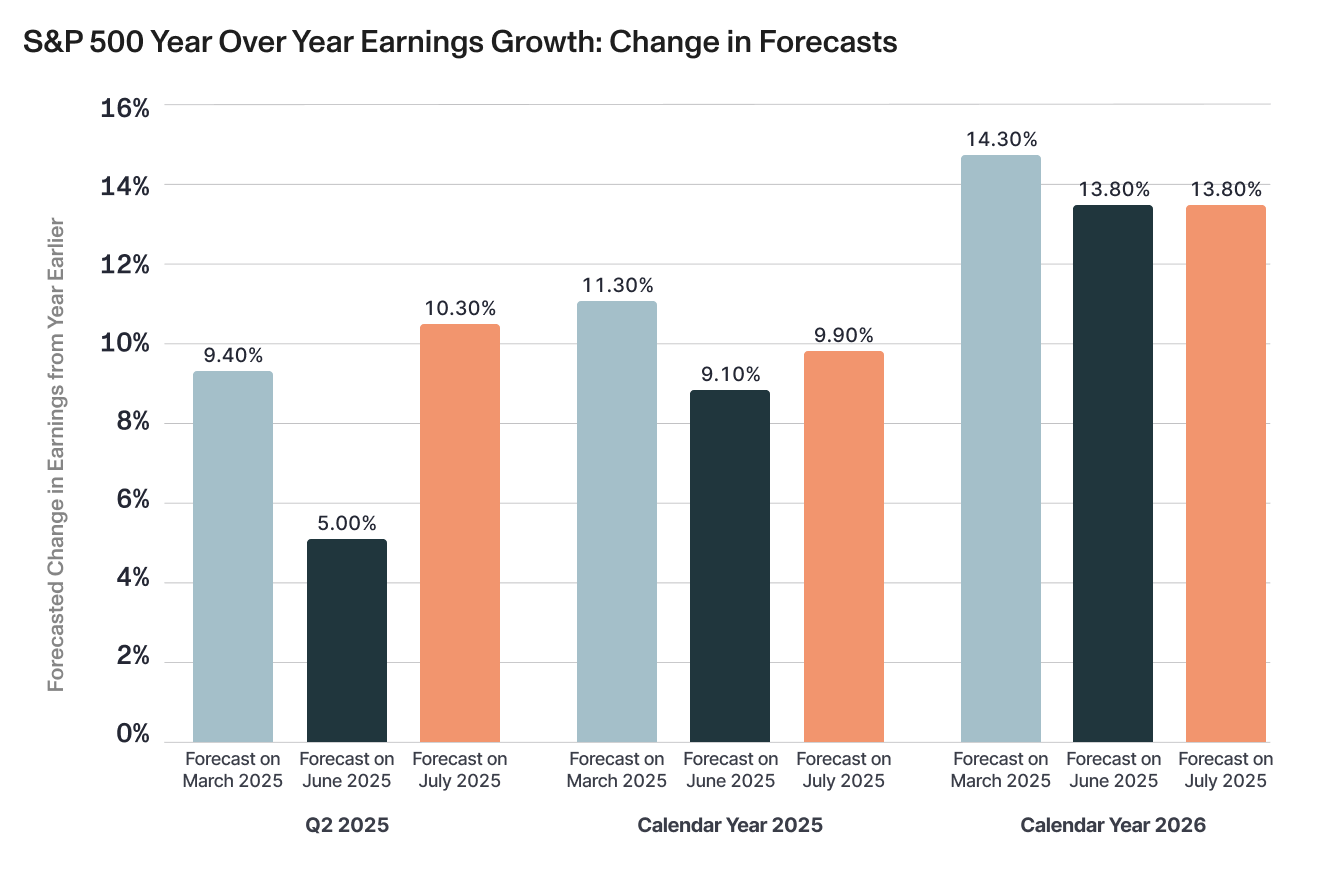
Corporate earnings released so far in Q2 have been strong with 82% of the 66% of S&P 500 companies that have reported through August 1 beating earnings expectations, the highest level since Q3 2021.48 The high beats rate is partly the result of analysts lowering Q2 estimates between April and June on tariff concerns. As the chart below shows, as actual Q2 results have come in, earnings growth is now expected to hit 10.3% for the quarter, up sharply from the 5% forecast at the end of June.
Much of the strong earnings growth continues to come from technology companies, especially the “Magnificent 7” stocks which are expected to account for 56% of Q2 earnings growth.49 Still, the solid results have been relatively broad, with eight of the eleven S&P sectors reporting year-over-year growth in earnings. Earnings for financials have been especially strong as the yield curve steepens and expectations of lower regulations. Only the consumer staples, materials and energy sectors show declines in earnings from a year earlier, with energy company results especially weak.
So far this reporting season, investors have rewarded Q2 positive earnings surprises slightly less than average but have punished negative earnings surprises reported much more than average. This higher impact from missing expectations is to be expected with valuations high and many sectors and companies priced for perfection.
Earnings — What to look out for:
- Any slowing in the exceptional future earnings outlook for AI related companies will hit the stock prices of those companies, and likely the overall market, very hard.
- Tariff costs have had little impact on company earnings in Q2, but that is likely to change in the second half of the year, testing companies' abilities to pass on tariff related costs.
Navigating the Path Forward
July illustrated the market's ongoing balancing act between optimism from strong equity returns driven by AI enthusiasm and corporate earnings strength, and concerns over uncertain trade and monetary policy amid signs of strain in underlying economic fundamentals. The month's conclusion — marked by escalating tariff threats and sharply revised employment data — underscored the fragility of this optimistic view. As we move further into the second half of 2025, three critical dynamics will likely determine market direction:
- Whether (and when) the Federal Reserve will cut interest rates as it navigates tariff-driven inflation pressures and a potentially weakening labor market.
- How effectively companies can absorb or pass through rising input costs without triggering reductions in earnings or consumer demand destruction.
- Whether the AI-driven earnings momentum that has powered market gains can sustain itself.
In this environment where 'the only certainty is uncertainty,' the convergence of these factors suggests that investors should prepare for increased volatility as policy uncertainty persists and the economic impact of tariffs fully materializes.
Compound provides everything you need to manage your finances (liquidity planning, concentrated position management, stock option optimization, and more).
[1] https://www.spglobal.com/spdji/en/index-family/equity/
[2] https://fred.stlouisfed.org/series/DGS10
[3] https://www.ey.com/en_us/insights/ipo/ipo-market-trends
[4] https://accessipos.com/figma-stock-ipo/
[5] https://www.cbo.gov/publication/61570
[6] https://www.federalreserve.gov/monetarypolicy/monetary20250730a.htm
[7] https://www.federalreserve.gov/newsevents/speech/waller20250801a.htm
[8] https://www.federalreserve.gov/newsevents/speech/bowman20250801a.htm
[9] https://www.bls.gov/news.release/cpi.nr0.htm
[10] https://www.bls.gov/news.release/empsit.nr0.htm
[11] https://www.bea.gov/news/2025/gross-domestic-product-2nd-quarter-2025-advance-estimate
[12] https://insight.factset.com/sp-500-earnings-season-update-august-1-2025
[13] https://www.spglobal.com/spdji/en/index-family/equity/
[14] https://insight.factset.com/sp-500-earnings-season-update-august-1-2025
[15] https://www.spglobal.com/spdji/en/index-family/equity/
[16] https://www.nasdaq.com/market-activity/index/comp
[17] https://www.spglobal.com/spdji/en/index-family/equity/
[18] https://www.msci.com/end-of-day-data-search
[19] https://www.spglobal.com/spdji/en/index-family/equity/
[20] https://www.spglobal.com/spdji/en/index-family/equity/
[21] https://www.msci.com/end-of-day-data-search
[22] https://www.nasdaq.com/market-activity/index/comp/historical
[23] https://www.spglobal.com/spdji/en/index-family/equity/
[24] https://www.spglobal.com/spdji/en/index-family/fixed-income/composite-global/#overview
[25] https://www.bea.gov/news/2025/personal-income-and-outlays-june-2025
[26] https://www.bea.gov/news/2025/personal-income-and-outlays-june-2025
[27] https://www.sca.isr.umich.edu/
[28] https://www.sca.isr.umich.edu/
[29] https://www.federalreserve.gov/monetarypolicy/monetary20250730a.htm
[30] https://www.bls.gov/news.release/empsit.nr0.htm
[31] https://www.bls.gov/news.release/jolts.nr0.htm
[32] https://www.adepmyomentreport.com/
[33] https://www.bls.gov/news.release/empsit.nr0.htm
[34] https://www.bls.gov/news.release/empsit.nr0.htm
[35] https://www.piie.com/publications/policy-briefs/2025/us-population-growth-slows-we-need-reset-expectations-economic-data
[36] https://www.bls.gov/news.release/empsit.nr0.htm
[37] https://www.bea.gov/news/2025/gross-domestic-product-2nd-quarter-2025-advance-estimate
[38] https://www.bea.gov/news/2025/gross-domestic-product-2nd-quarter-2025-advance-estimate
[39] https://www.bea.gov/news/2025/gross-domestic-product-2nd-quarter-2025-advance-estimate
[40] https://www.bea.gov/news/2025/gross-domestic-product-2nd-quarter-2025-advance-estimate
[41] https://www.bea.gov/news/2025/gross-domestic-product-2nd-quarter-2025-advance-estimate
[42] https://www.federalreserve.gov/releases/z1/dataviz/z1/balance_sheet/chart/
[43] https://libertystreeteconomics.newyorkfed.org/2025/05/student-loan-delinquencies-are-back-and-credit-scores-take-a-tumble/
[44] https://www.census.gov/retail/sales.html
[45] Carlyle Economic Indicators, July 2025
[46] https://www.bea.gov/news/2025/personal-income-and-outlays-june-2025
[47] https://www.census.gov/retail/sales.html
[48] https://insight.factset.com/sp-500-earnings-season-update-august-1-2025
[49] https://insight.factset.com/sp-500-earnings-season-update-august-1-2025
[50] https://insight.factset.com/sp-500-earnings-season-update-august-1-2025