A Year of Contradictions

Compound is a digital family office for entrepreneurs, professionals, and retirees who want the personal touch of a dedicated advisor accompanied by a beautiful digital experience.
U.S. equities delivered one of the strongest recoveries in history even as inflation remained stubbornly elevated, labor market data grew increasingly murky, and policy uncertainty intensified.
After falling more than 15% by early April, the S&P 500 rallied 38% to finish the year up 17% as it climbed a wall of worry shaped by tariffs, shifting Federal Reserve policy, and rising expectations for AI-driven earnings growth.
Beneath the surface, the economy rebounded sharply, but the forces driving growth became more uneven and more fragile, setting the stage for a 2026 defined less by broad momentum and more by critical turning points.
2025 at a glance
- Historic Market Comeback: After one of the worst starts to a year on record, the S&P 500 rallied sharply from April lows to finish 2025 up 17%.
- Stronger-Than-Expected Economy: U.S. growth rebounded meaningfully after a weak first quarter, with economic activity surprising to the upside despite higher rates.
- Trade Policy Shock and Recovery: Markets sold off sharply following sweeping tariff announcements in April but rebounded as implementation was paused and U.S.–China tensions eased.
- A Complicated Fed Backdrop: The Federal Reserve began cutting rates amid slowing labor data and persistent inflation, with rising disagreement among policymakers.
- Policy Support Returns: Quantitative tightening ended and fiscal stimulus increased, adding liquidity but also raising concerns about longer-term deficits.
- Concentrated Market Leadership: Equity gains were driven primarily by large-cap technology and AI-related companies, leaving markets more dependent on a narrow group of leaders.
- Elevated Valuations: Strong earnings growth supported higher prices, but markets ended the year with little margin for disappointment.
Stocks continue a remarkable rally
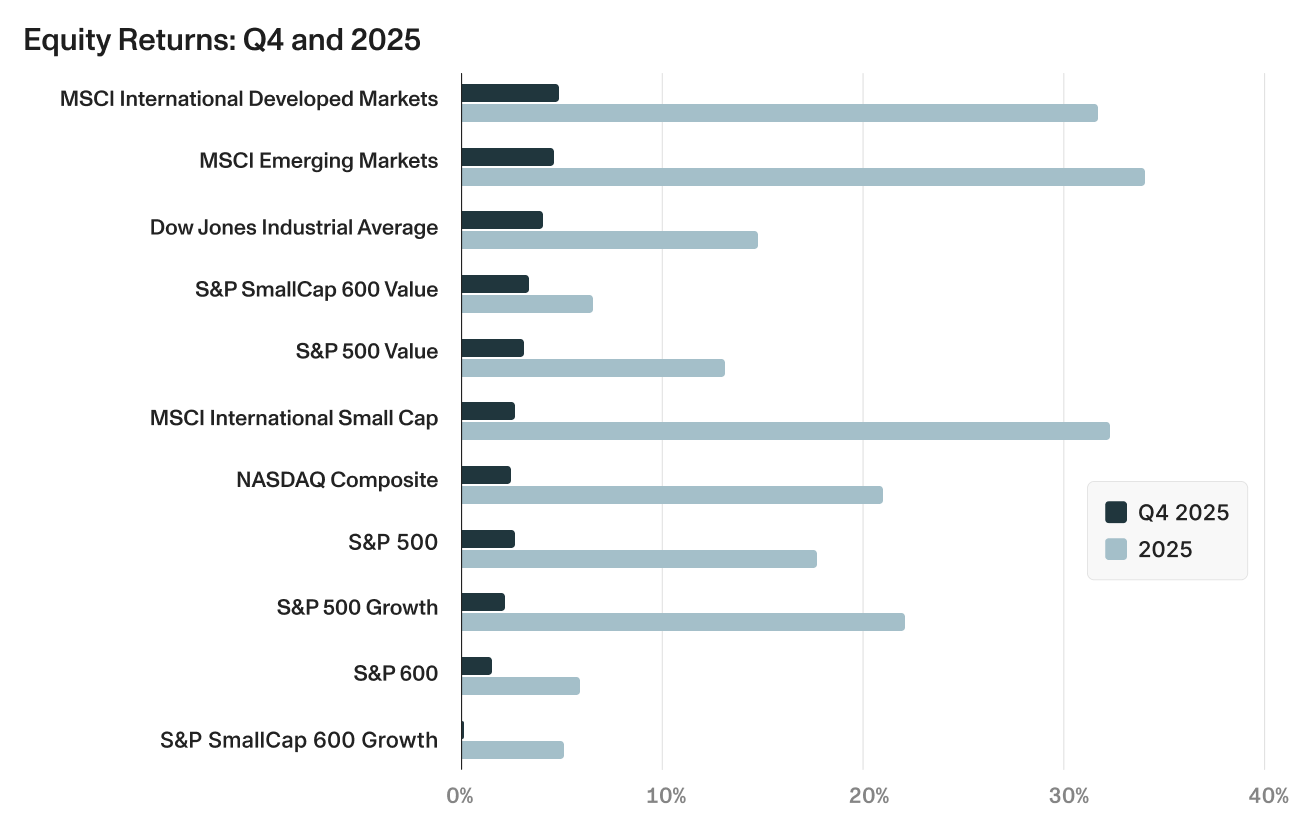
Equity markets closed the year on a strong note, with the S&P 500 gaining 2.66% in Q4 to finish 2025 up 17.88%. The quarter was marked by multiple record highs despite late-December concerns about AI spending following disappointing results from Oracle and Broadcom. International markets significantly outperformed U.S. equities, both developed and emerging markets, driven largely by dollar weakness and valuation expansion. There were some hints of style rotation to end the year, but the full year was characterized by continued dominance of growth over value and technology and AI themes.
- The S&P 500 rebounded 38% from April lows after the fourth-worst start to a year on record.
- Developed markets and emerging markets significantly outpaced U.S. equities, driven by dollar weakness and valuation expansion, catching many investors off guard.
- Value outperformed growth in Q4 among U.S. large cap stocks, and the Dow outpaced the NASDAQ, suggesting early signs of broadening despite growth and the NASDAQ dominating for the full year.
- The small cap S&P 600 gained only 6.02% for the year as small cap earnings continued to lag large cap earnings growth.
- Volatility subsided to end the year, with the VIX falling to 14 by year end after spiking above 60 during April's "Tariff Tantrum."
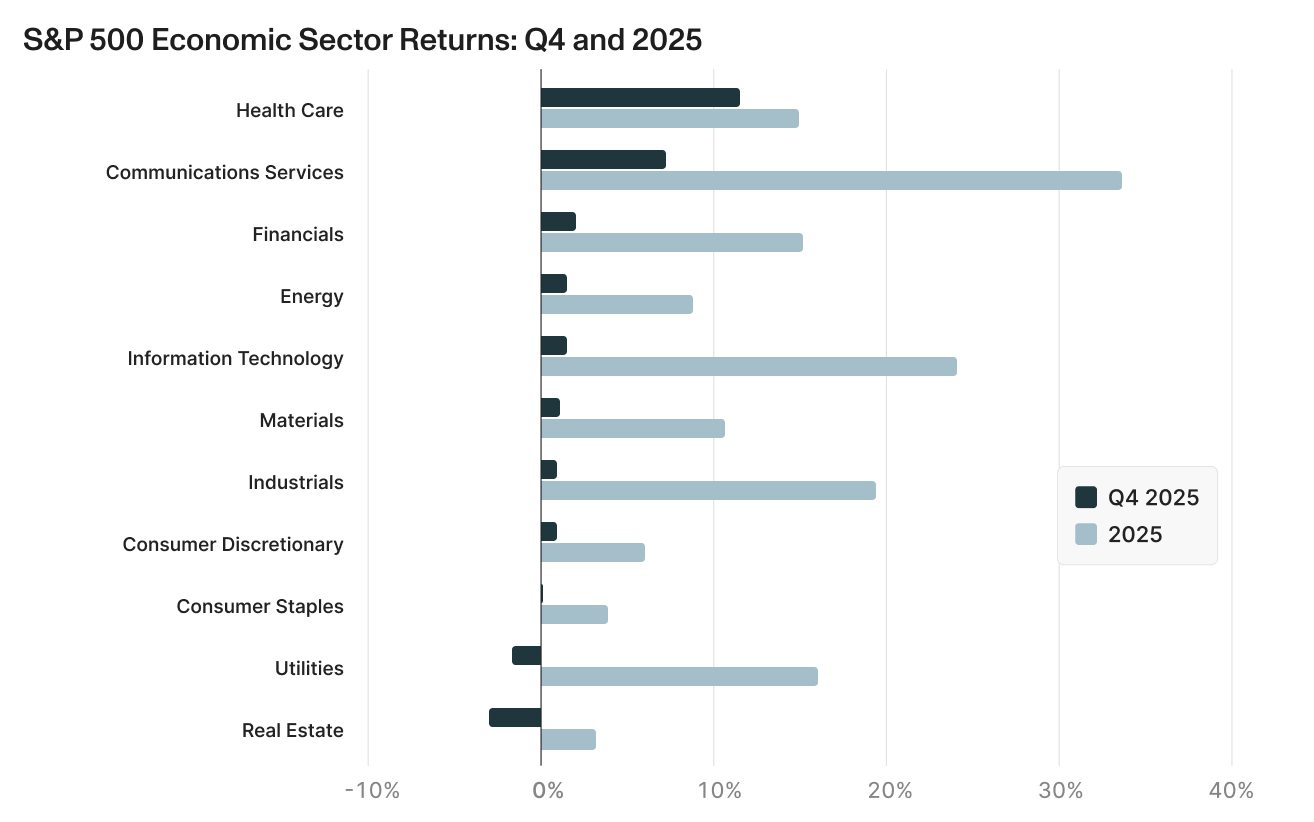
- Q4 witnessed a meaningful rotation from the technology sectors that powered 2025's gains while defensive sectors continued to lag:
- Health Care surged in Q4 to lead all sectors.
- Defensive sectors struggled in Q4 and for the full year with Real Estate and Utilities being the only sectors posting losses in Q4 and Utilities experiencing a particularly tough December.
- Financials posted a solid gain in Q4 and for the full year, benefiting from a steeper yield curve, rate cuts that should boost lending activity, and strong fundamentals.
- Communication Services and Information Technology led the full year as AI infrastructure spending approached $500 billion and the Magnificent 7 delivered exceptional earnings growth.
Bonds post a solid year as rates fall
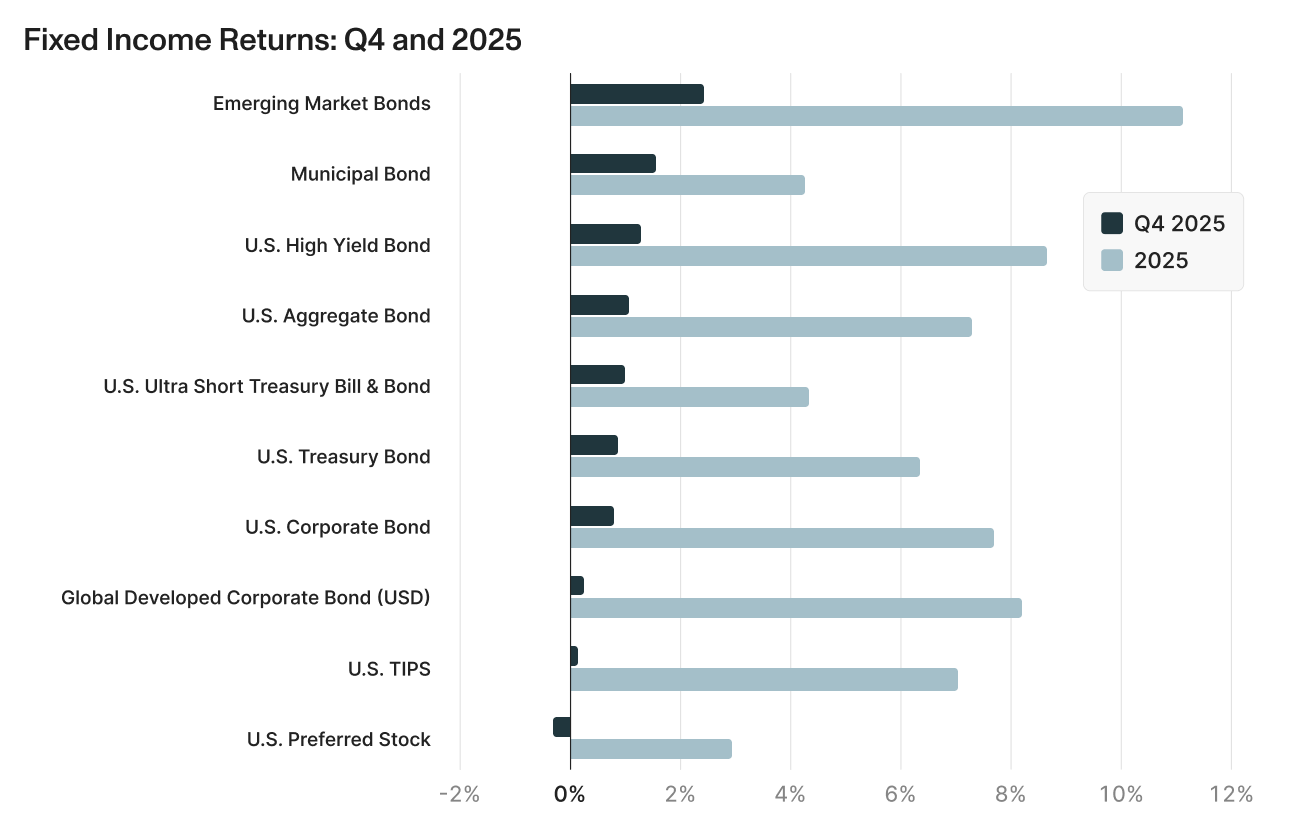
The bond market delivered its strongest year since 2020 as falling yields and 75 basis points of Fed rate cuts sparked a broad rally across fixed income. Riskier segments outperformed throughout 2025, with U.S. high yield bonds and Emerging Market Bonds leading fixed income categories, supported by resilient economic growth and low default rates. Q4 saw a shift as long-term yields rose despite rate cuts—the 30-year Treasury climbed from below 4% when cuts began to above 4.8% by year-end—reflecting market concerns about higher long-term inflation.
- Emerging Market Bonds topped all fixed income categories for 2025, benefiting from dollar weakness and strong demand for yield.
- U.S. high yield and Corporate Bonds outperformed core bonds as credit spreads remained tight.
- Municipal bonds significantly underperformed for the year despite posting a solid Q4, weighed down by record supply issuance and uncertainty around tax policy changes.
- Despite the Fed cutting 75 basis points in 2025, longer-duration bonds struggled in the quarter.
Private Markets show diversification benefits
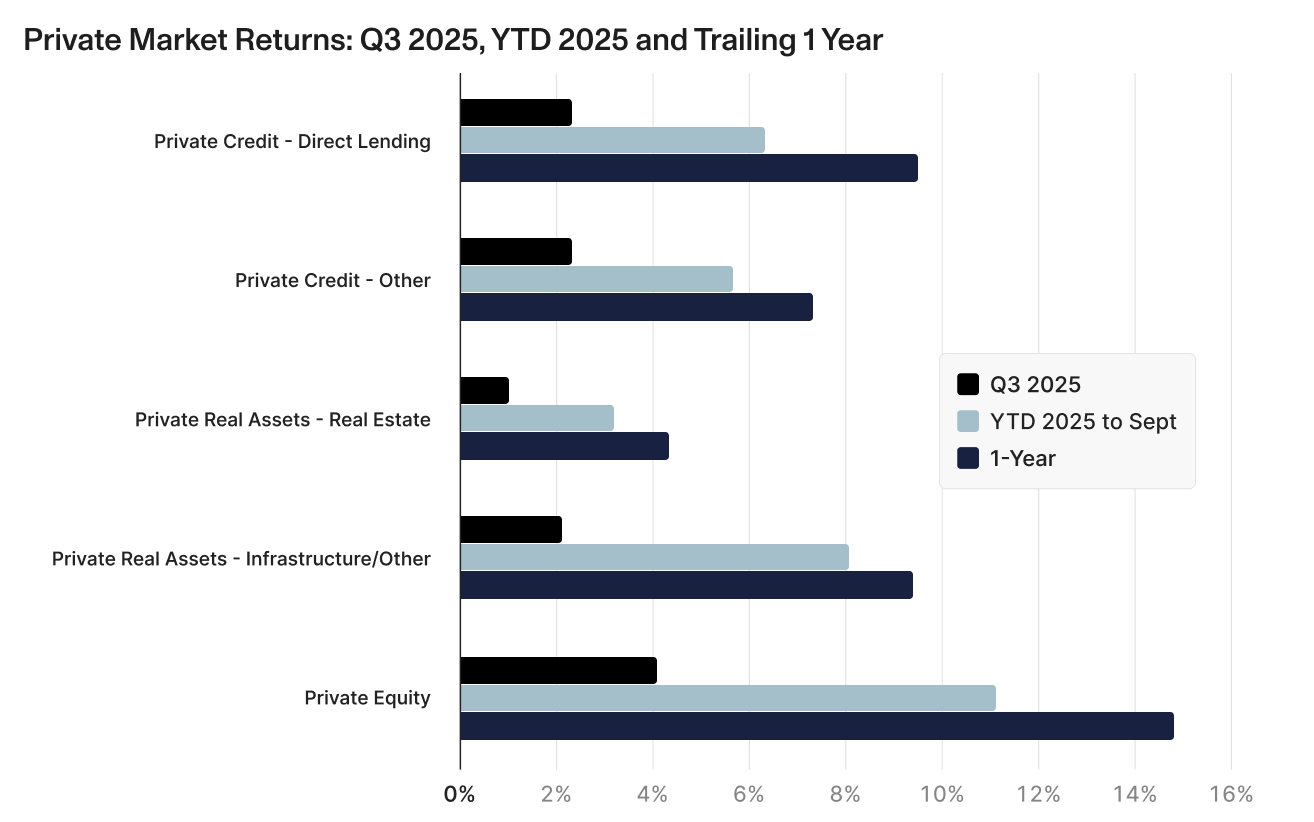
Private markets provided an important diversification benefit throughout 2025's volatility, with all asset classes posting positive Q3 returns and solid year-to-date performance through September. A key benefit of private market investments in 2025 was their lower volatility profile compared to public markets, which proved especially valuable during the multiple public market pullbacks clustered around policy shocks this year, including April's sharp selloff.
- Private Equity led for the quarter and year so far, marking its strongest quarterly performance since 2021 and demonstrating a notable rebound after several quarters of weakness. Distributions continued to slow as managers awaited better exit opportunities, driving the growing importance of secondary markets and continuation funds.
- Private Credit continued delivering steady returns, both for direct lending and other strategies, supported by resilient economic growth and low default rates despite concerns over substantial asset flows into the category and several high profile bankruptcies at several large borrowers.
- Private Real Assets showed mixed results, with infrastructure funds posting strong quarterly and year-to-date returns, while real estate continued to lag although the sector showed signs of recovery with improving valuations and transaction volumes.
Looking forward: Key questions for 2026
How will the Fed navigate persistent inflation and slowing employment?
The labor market heading into 2026 presents a significant challenge for Fed policymakers attempting to calibrate monetary policy. The Bureau of Labor Statistics data reveals that the U.S. has added an average of just 10,000 jobs per month over the final four months of 2025, the fewest since the 2020 recession. Total employment growth for the year came in at only 0.6%, the slowest pace since March 2021.6 In the past 50 years, this type of weakness has historically preceded a recession and a spike in unemployment. Adding to concerns, ADP private payroll data painted an even grimmer picture, showing an average loss of 4,000 jobs per month over the last three months of the year, with November alone seeing a loss of 32,000 private sector jobs. The November slowdown was broad-based but led by a pullback among small businesses, according to ADP chief economist Dr. Nela Richardson, who noted that "hiring has been choppy of late as employers weather cautious consumers and an uncertain macroeconomic environment."7
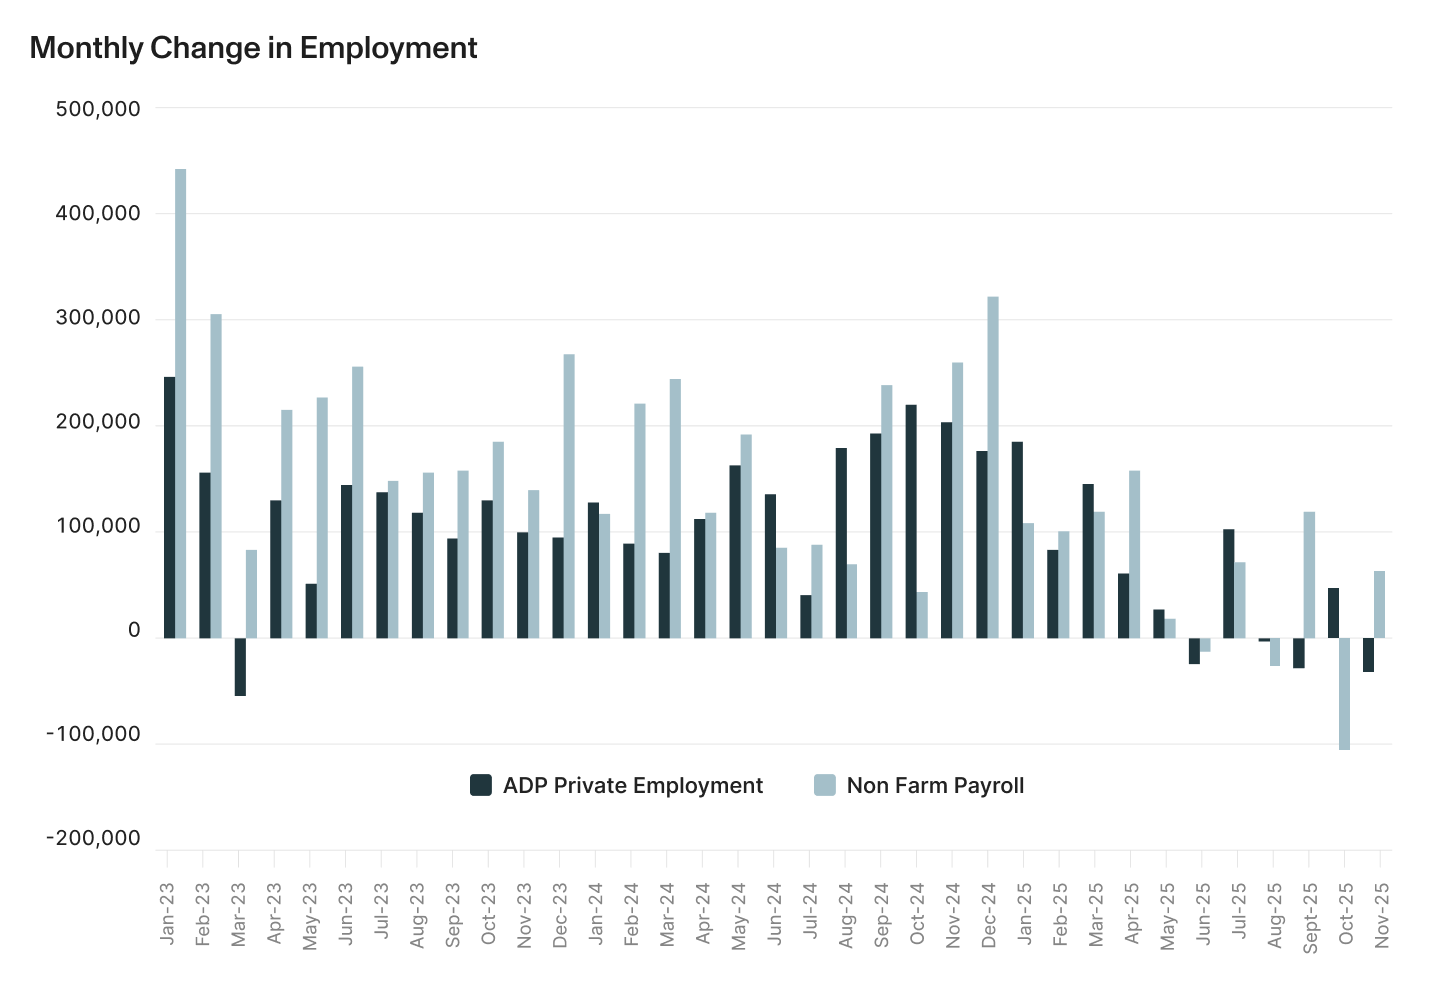
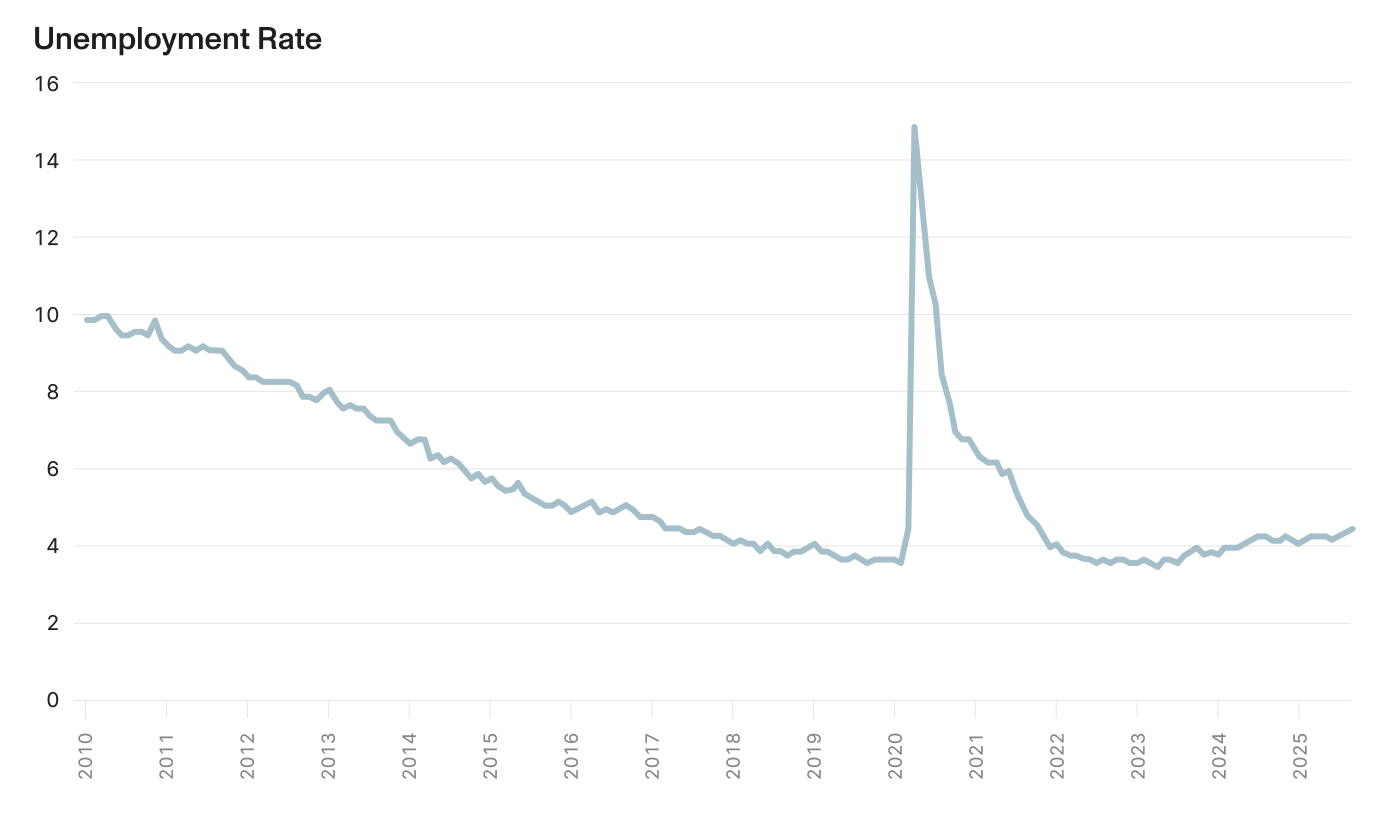
The unemployment rate rose to 4.6% in November, the highest level since September 2021, but the signal is not entirely clear. Fed Chair Powell acknowledged that the situation is "complicated, unusual, and difficult," noting that the U.S. may have been overstating jobs by up to 60,000 per month, meaning part of the decline reflects statistical shifts rather than actual deterioration in the job market.10 In addition, a Minneapolis Fed analysis found that roughly half of the payroll decline can be attributed to reduced immigration.11 The critical distinction for investors is between a cooling labor market where companies slow hiring rates and a recessionary labor market where companies actively reduce their workforce due to declining demand.
Inflation heading into 2026 presents an equally complex challenge, remaining stubbornly above the Fed's 2% target for over 50 months despite some recent moderation. November's CPI reading of 2.7% came in well below the consensus estimate of 3.1%, with core inflation decelerating to the lowest level since early 2021.13 The decline in shelter CPI inflation from 3.6% year-over-year in September to 3.0% in November was the main factor bringing down overall CPI, but there was concern that some missing measures due to the government shutdown impacted the reliability of the data. The Fed's preferred PCE inflation measure showed the headline accelerating to 2.8% in September from 2.7% in August, while core PCE (excluding food and energy) slowed to 2.8% from 2.9%.
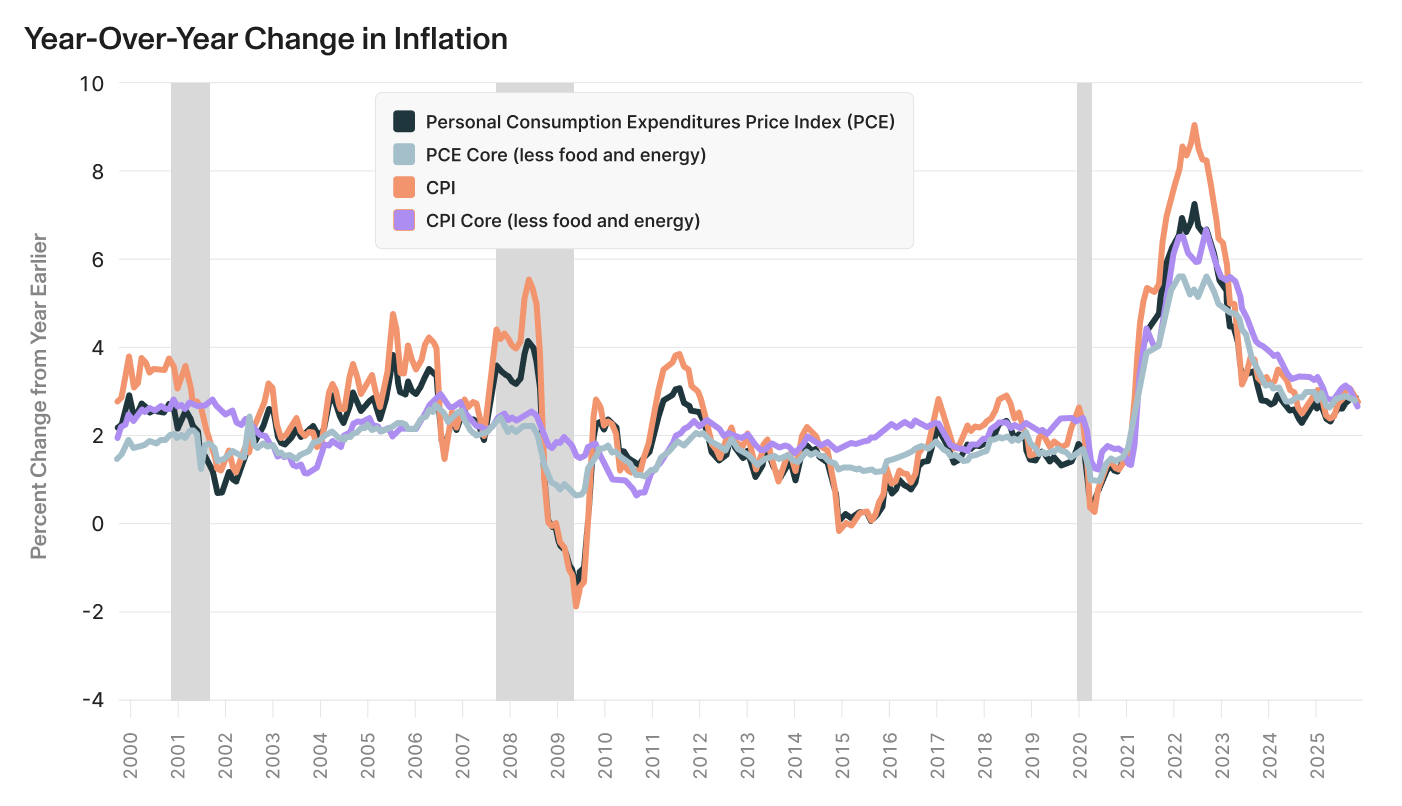
Looking ahead, the inflation outlook remains clouded by competing forces. Tariffs, which are estimated to have added roughly 50 basis points to inflation in 2025, are expected to boost year-over-year inflation through the first half of 2026 as retailers increasingly pass costs on to consumers after absorbing most of the burden in 2025. However, several deflationary forces are building. Housing inflation, which comprises 36% of CPI, shows signs of softening with rental price inflation negative for over two years. Gas prices, another component, have fallen to their lowest level in over 4 years.16
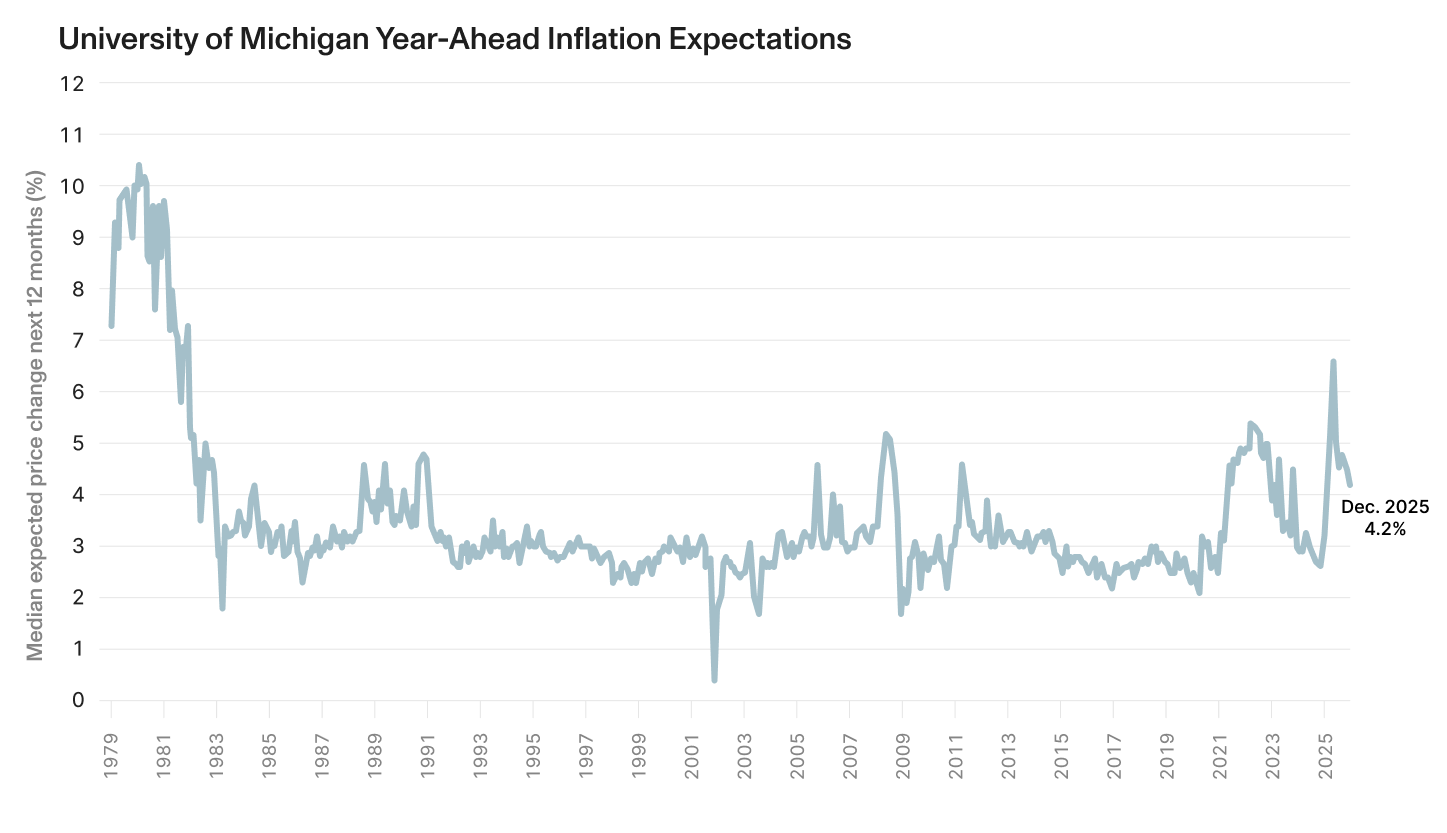
The easing of some components of inflation is reflected in consumer surveys. The University of Michigan year-ahead inflation expectations measure decreased for the fourth consecutive month to 4.2% in December, the lowest reading in 11 months though still elevated above the 3.3% seen in January 2025.17 Long-run inflation expectations eased to 3.2%, matching January's reading but well above the sub-2.8% levels seen throughout 2019-2020.
Fed Policy — What to look out for:
- Assessment of “new normal” monthly job gains
- Trends in inflation
- Fed member comments and announcement of new Chair
Can AI-driven earnings growth justify current valuations, or will expectations need to be recalibrated?
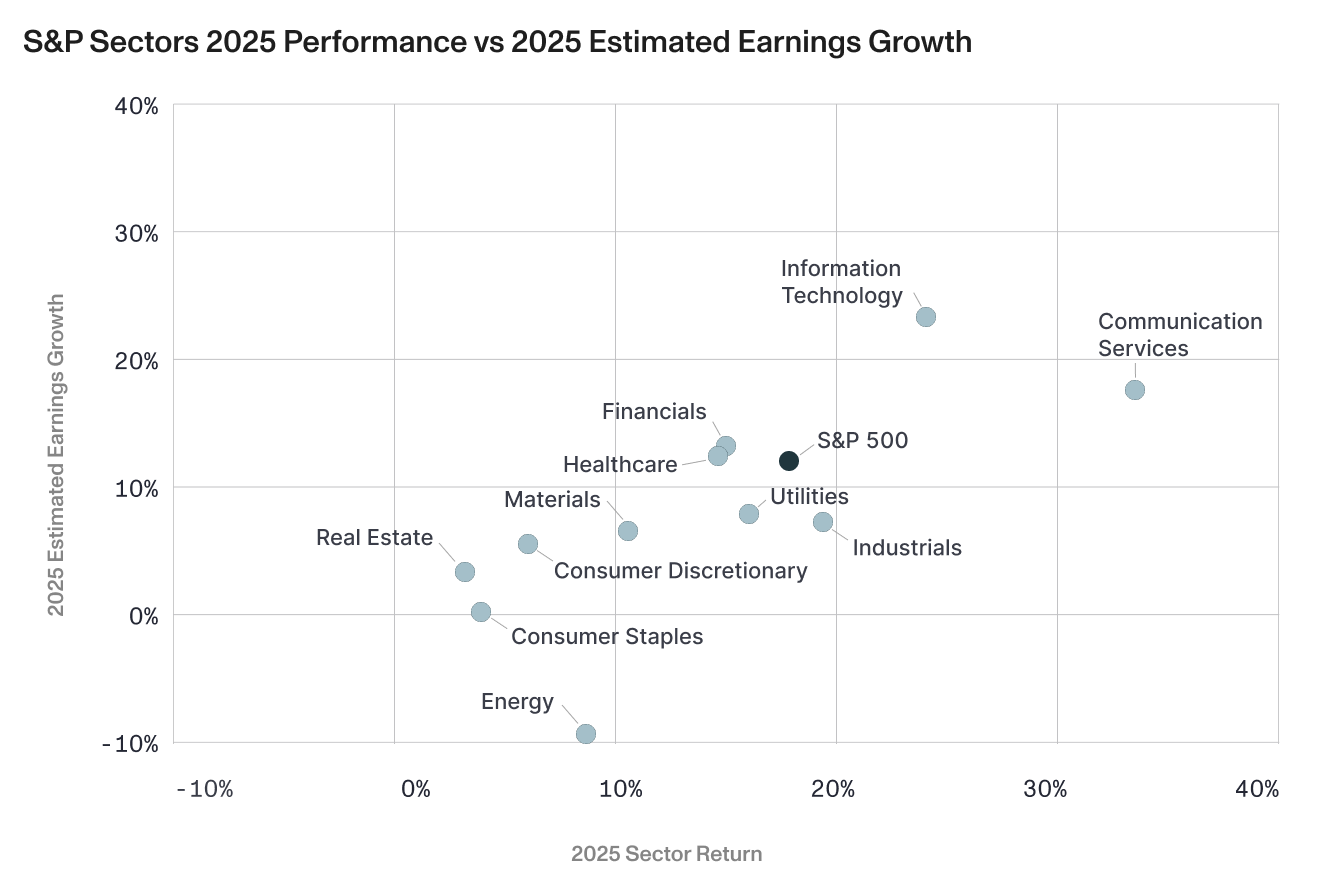
The relationship between AI-driven earnings growth and market valuations remains one of the most critical questions heading into 2026. In 2025, as the chart below shows, there was a relatively tight correlation between equity sector performance and corresponding earnings growth.19 Communication Services and Information Technology—the two sectors most exposed to AI infrastructure spending and adoption—delivered the strongest returns at 33.55% and 24.04% respectively, closely aligned with their estimated earnings growth of approximately 18% and 23%.
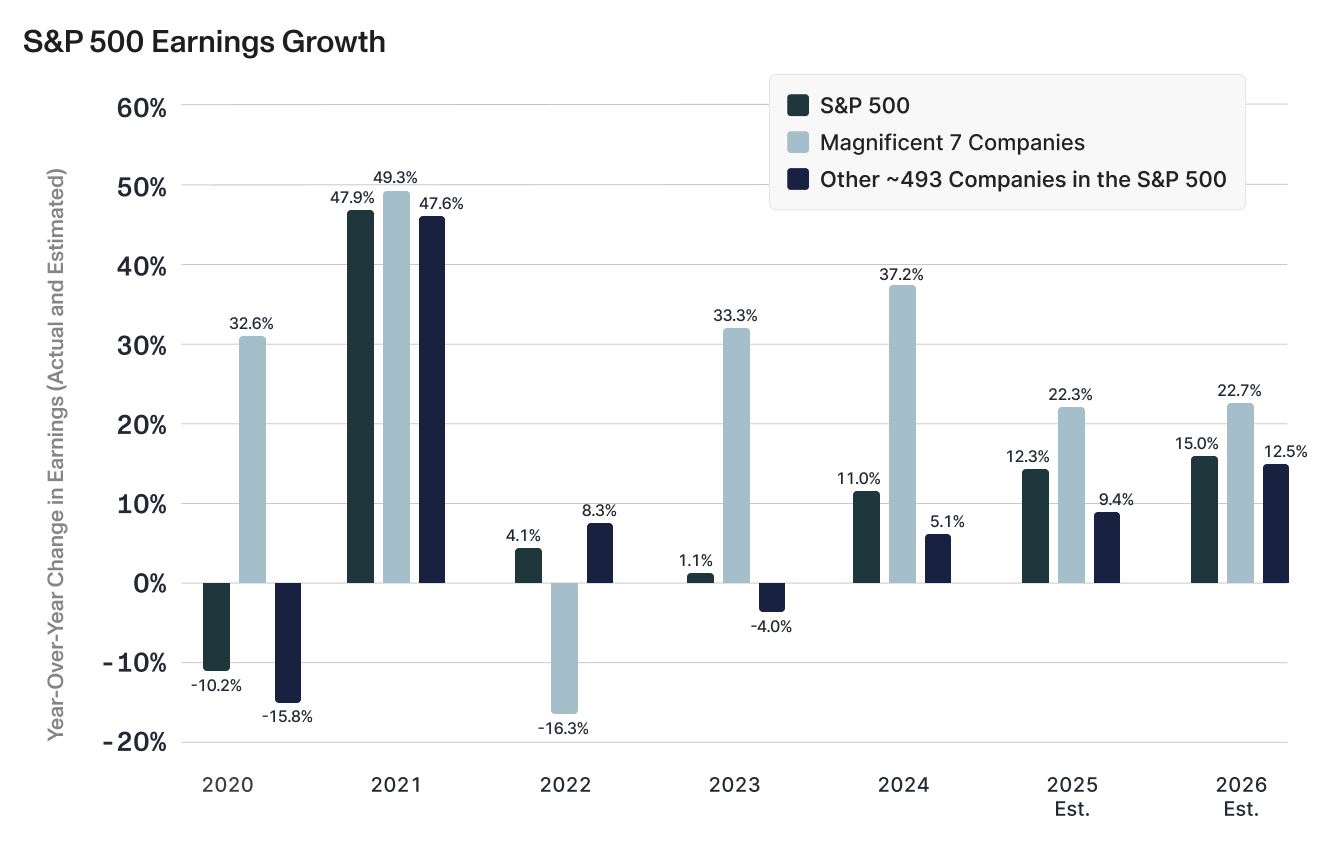
This performance was driven by extraordinary earnings from the Magnificent 7 companies, which are expected to post 22% earnings growth in 2025 compared to just 9% for the other 493 companies in the S&P 500.21 The earnings divergence has been building since 2020, when both groups experienced steep declines during the pandemic. Looking ahead, analysts project the Mag7 will deliver 22.7% earnings growth in 2026 while the other 493 companies are expected to accelerate to 12.5% growth, up from 9.4% in 2025, suggesting some broadening but continued leadership from AI-centric names.
However, the critical question is whether current valuations have run ahead of even these optimistic earnings projections. The Mag7 currently trades at forward P/E ratios around 30x—well below the 50x+ levels seen for the companies most associated with the late 1990s tech bubble—but still elevated relative to history and implying earnings growth at current levels far into the future. Q4 provided some cautionary examples of the market's sensitivity to any sign that AI spending might not meet lofty expectations, with Oracle's 13% decline and Broadcom's 7.8% drop in mid-December following disappointing quarterly results. These reactions suggest the market has many of these stocks "priced for perfection," with little room for disappointment on either AI infrastructure spending—projected at $500 billion in 2026 with some estimates reaching $3-4 trillion cumulatively by decade's end—or on companies' ability to monetize these massive investments.
Still, unlike the dot-com era, today's AI cycle is being financed by profitable, cash-rich firms with robust fundamentals. The Tech sector's free-cash-flow margin near 20% is more than double its late 1990s levels, and dominant companies have particularly strong balance sheets financing AI investments through free cash flow rather than debt. The Mag7 companies rank well above average on fundamental metrics like returns on equity and profit margins, supporting the view that current valuations are justified by strong fundamentals rather than speculation.
Yet the risks of a valuation recalibration remain substantial. As one near-term risk scenario, any loss of luster in the AI narrative—triggered by mega cap earnings misses, supply constraints on power or critical materials, or an external liquidity shock—could cause a swift pullback in the overall market or at minimum pressure the AI-linked wealth gains that have lifted consumption. The significance of AI investment to the broader economy means such a slowdown could have ripple effects beyond just technology stocks.
AI Investment Concerns — What to look out for:
- Increases in leverage ratios for AI leaders
- Divergence in types of AI related companies leading market
- Earnings misses from bellwether companies
How will consumers and businesses adapt to the "new normal" of elevated but stable inflation?
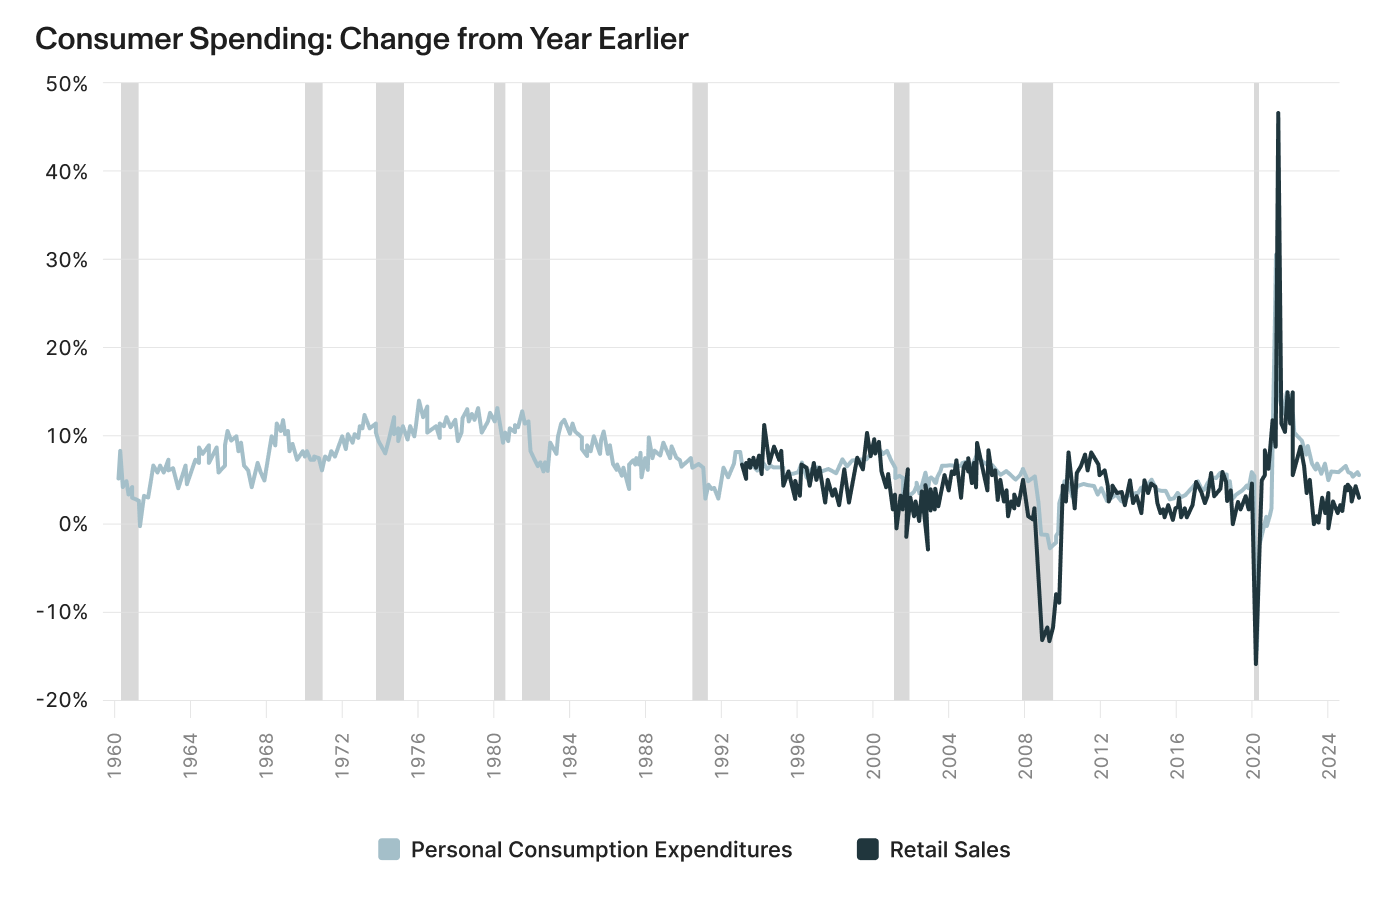
The paradox of the American consumer heading into 2026 is a disconnect between sentiment and spending. Consumer spending has remained remarkably resilient through 2024-2025, hovering in the mid-single-digit range year-over-year despite nearly five years of inflation running well above the Fed's 2% target.23 24 This resilience has been supported by the wealth effect from the S&P 500's 18% gain in 2025 and household net wealth nearly doubling over the past decade. As the U.S. consumer drives 70% of GDP, the strength of the overall economy depends on spending remaining relatively strong. Any protracted sell-off in the equity markets could threaten the strength of spending at the top of the income distribution, which has so far offset weakness among lower-income consumers.
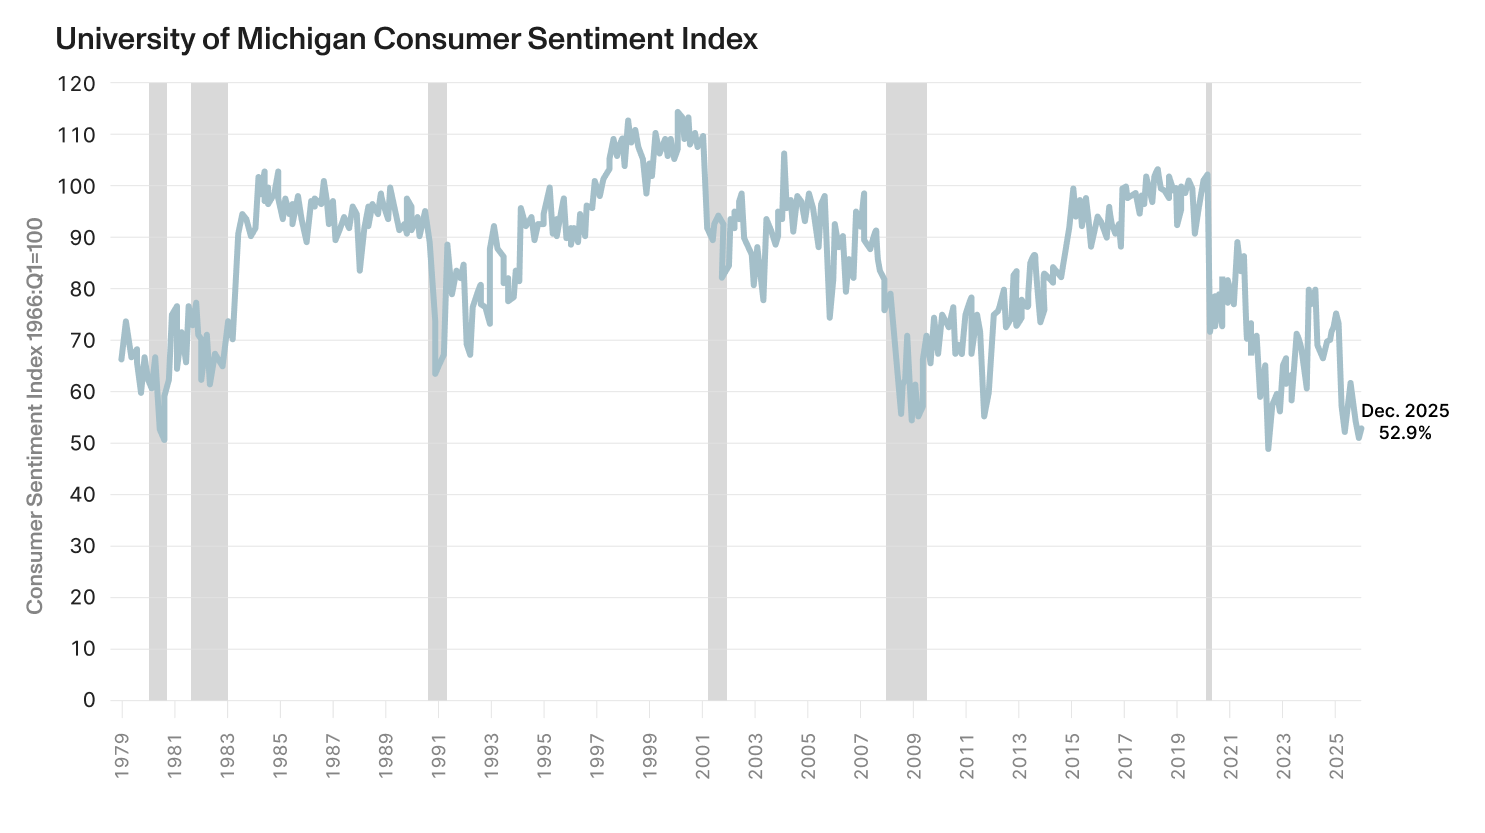
Consumer sentiment tells a somewhat different story. The University of Michigan Consumer Sentiment Index fell sharply to 52.9 in December 2025 and is now down 29% from December 2024 to levels seen only during the early 1980s recession, 2008 financial crisis, and COVID pandemic.27 This typically signals an impending recession, yet consumers have kept spending. Part of this disconnect stems from methodology: the University of Michigan's 2024 transition from phone to web surveys (web responses trend more downbeat) artificially biases the index roughly 6.6 points lower.28 Additionally, sentiment is particularly sensitive to prices rather than employment, so cumulative inflation since 2020 makes consumers feel squeezed even as nominal incomes grow and job security remains solid.29
A key question for 2026 is whether persistently elevated inflation will weaken consumer spending. Several factors suggest resilience: OBBB tax refunds creating a flow of liquidity in early 2026, potentially declining mortgage rates, and falling gas prices. The risk remains that the cumulative weight of five years of above-target inflation, combined with a weakening labor environment and fading fiscal stimulus in the back half of 2026, finally causes consumers to pull back. If spending remains resilient, earnings growth will drive markets higher. If the consumer tightens spending, it could threaten economic expansion.
Consumer spending concerns — What to look out for:
- A sell-off in the equity market that has bolstered spending for wealthier households
- Rising consumer debt levels or loan delinquencies.
- Inflationary concerns
Navigating the Path Forward
Markets can continue to climb a wall of worry when fundamentals remain intact, but 2026 is likely to reward selectivity over broad exposure. Persistent inflation, a cooling but constrained labor market, elevated valuations, and rising fiscal imbalances point to a more complex investment environment than recent years. At the same time, the underlying supports remain constructive: solid corporate earnings growth, unprecedented AI investment driving productivity gains, fiscal policy supporting demand, and a Federal Reserve increasingly focused on sustaining growth. For investors willing to navigate volatility and remain disciplined through periods of uncertainty, 2026 presents meaningful opportunities, even if the path forward proves uneven.
Compound provides everything you need to manage your finances (liquidity planning, concentrated position management, stock option optimization, and more).
[1] https://www.spglobal.com/spdji/en/index-family/equity/
[2] https://www.msci.com/end-of-day-data-search
[3] https://www.nasdaq.com/market-activity/index/comp/historical
[4] https://www.spglobal.com/spdji/en/index-family/equity/
[5] https://www.spglobal.com/spdji/en/index-family/fixed-income/
[6] https://www.bls.gov/news.release/empsit.nr0.htm
[7] https://adpemploymentreport.com/
[8] https://www.bls.gov/news.release/empsit.nr0.htm
[9] https://adpemploymentreport.com/
[10] https://www.federalreserve.gov/mediacenter/files/FOMCpresconf20251210.pdf
[11] https://www.minneapolisfed.org/article/2025/immigration-cant-explain-declining-employment-growth
[12] https://www.bls.gov/news.release/empsit.nr0.htm
[13] https://www.bls.gov/news.release/cpi.nr0.htm
[14] https://www.bea.gov/data/personal-consumption-expenditures-price-index
[15] https://www.bls.gov/news.release/cpi.nr0.htm
[16] https://www.bls.gov/news.release/cpi.nr0.htm
[17] https://www.sca.isr.umich.edu/
[18] https://www.sca.isr.umich.edu/
[19] https://insight.factset.com/sp-500-cy-2026-earnings-preview-analysts-expect-earnings-growth-of-15
[20] https://insight.factset.com/sp-500-cy-2026-earnings-preview-analysts-expect-earnings-growth-of-15
[21] https://insight.factset.com/sp-500-cy-2026-earnings-preview-analysts-expect-earnings-growth-of-15
[22] https://insight.factset.com/sp-500-cy-2026-earnings-preview-analysts-expect-earnings-growth-of-15
[23] https://www.bea.gov/data/consumer-spending/main
[24] https://www.census.gov/retail/sales.html
[25] https://www.bea.gov/data/consumer-spending/main
[26] https://www.census.gov/retail/sales.html
[27] https://www.sca.isr.umich.edu/
[28] https://www.sca.isr.umich.edu/files/methodtransitionannouncement2024.pdf#:~:text=Since%20the%20University%20of%20Michigan%20began%20collecting,interviewing%20via%20web%20surveys%20with%20address%2Dbased%20sampling
[29] JP Morgan Weekly Market Recap, Dec. 29, 2025
[30] https://www.sca.isr.umich.edu/